Unlock a world of possibilities! Login now and discover the exclusive benefits awaiting you.
- Qlik Community
- :
- All Forums
- :
- QlikView App Dev
- :
- Re: Calculates values in a PivotTable
- Subscribe to RSS Feed
- Mark Topic as New
- Mark Topic as Read
- Float this Topic for Current User
- Bookmark
- Subscribe
- Mute
- Printer Friendly Page
- Mark as New
- Bookmark
- Subscribe
- Mute
- Subscribe to RSS Feed
- Permalink
- Report Inappropriate Content
Calculates values in a PivotTable
Hi guys,
I'm trying to calculate the total amount of money that the company has spent on leads,
by suppliers that the company works with,by day,by country and by product.
In order to display so, I used a pivot table with 2 Cyclic groups,
The problem is:
When I filter: Day=1
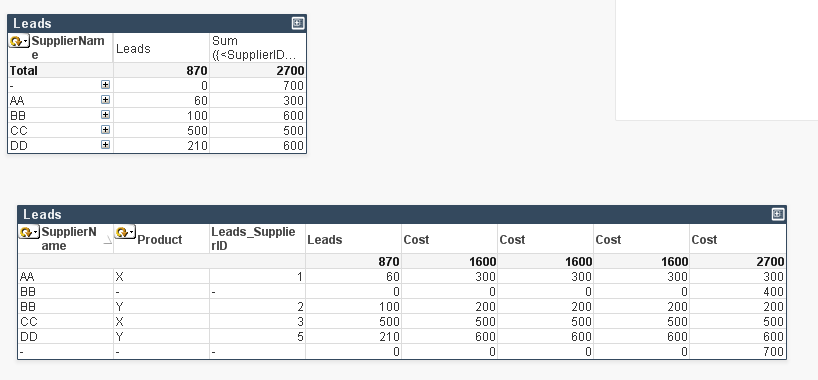
and select (in the first cyclic group) the dimension "Supplier Name", I'm getting the result that for 860 leads I spent 1,600$ cost (the Correct result!)!!
and when I select (in the first cyclic group) the dimension "Day" I'm getting the result that for 860 leads I spent 1,120$ cost
(wrong answer)!
Why the result changes when I display the data with another dimension?
The expression I use the calculate the Cost:
=sum(aggr(
if(Match(Leads_SupplierID,1,2,3,4),sum(CostAPI),
sum({<Leads_SupplierID={5}>}Cost * 2) //Google
+sum({<Leads_SupplierID-={5}>}Cost))
,$(=GetCurrentField([Cyclic1])),$(=GetCurrentField([Cyclic2]))))
I have included an example QVW
Thanks in advance
- « Previous Replies
-
- 1
- 2
- Next Replies »
- Mark as New
- Bookmark
- Subscribe
- Mute
- Subscribe to RSS Feed
- Permalink
- Report Inappropriate Content
May be with a little modification in the script
- Mark as New
- Bookmark
- Subscribe
- Mute
- Subscribe to RSS Feed
- Permalink
- Report Inappropriate Content
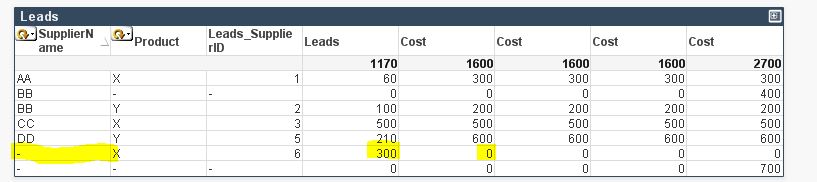
Thanks, but sometimes I have cases that leads are entered from a certain supplier and we didn't pay the supplier, meaning there won't be a line in the cost table
I added a row in the leads table, in the attached qvw.
Look at the added line, I want to display the name of the supplier=FF
- Mark as New
- Bookmark
- Subscribe
- Mute
- Subscribe to RSS Feed
- Permalink
- Report Inappropriate Content
histalwar1 do you have an idea?
- Mark as New
- Bookmark
- Subscribe
- Mute
- Subscribe to RSS Feed
- Permalink
- Report Inappropriate Content
Checking....
- Mark as New
- Bookmark
- Subscribe
- Mute
- Subscribe to RSS Feed
- Permalink
- Report Inappropriate Content
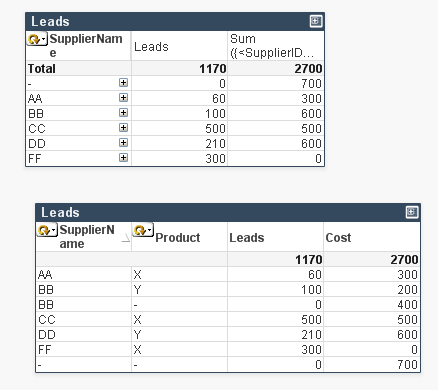
Try this data model
Leads:
LOAD
hash128(Leads_Day,Leads_SupplierID,Leads_Country) as Cost_key,//Key*
*;
LOAD * INLINE [
Leads_Day, Leads_SupplierID, Leads_SupplierName, CountLeads, Leads_Country, Product
1, 1, AA, 30, Australia, X
1, 1, AA, 30, Bahamas, X
1, 2, BB, 100, Bahamas, Y
1, 3, CC, 500, Bolivia, X
1, 5, DD, 200, Australia, Y
2, 5, DD, 10, Bahamas, Y
1, 6, FF, 300, Bahamas, X
];
Cost:
LOAD hash128(Day,SupplierID,Country) as Cost_key,//Key*
*;
LOAD * INLINE [
SupplierID, CostAPI, Cost, Day, Country
1, 100, 20, 1, Australia
1, 200, 0, 1, Bahamas
2, 200, 0, 1, Bahamas
2, 400, 500, 2, Bahamas
3, 500, 200, 1, Bolivia
4, 700, 0, 1, Australia
5, 800, 300, 1, Australia
5, 20, 0, 2, Bahamas
];
LinkTable:
LOAD DISTINCT Cost_key,
SupplierID,
Country,
'Cost' as Flag
Resident Cost;
Left Join (LinkTable)
LOAD DISTINCT Leads_SupplierID as SupplierID,
Leads_SupplierName as SupplierName
Resident Leads;
Concatenate (LinkTable)
LOAD DISTINCT Cost_key,
Leads_SupplierID as SupplierID,
Leads_SupplierName as SupplierName,
Leads_Country as Country,
'Leads' as Flag
Resident Leads;
DROP FieldS Leads_SupplierName, Leads_SupplierID, Leads_Country From Leads;
DROP Fields SupplierID, Country From Cost;
Expressions
Sum(CountLeads)
Sum({<SupplierID = {1, 2, 3, 4}>} CostAPI) + Sum({<SupplierID = {5}>} Cost * 2) + Sum({<SupplierID -= {1, 2, 3, 4, 5}>} Cost)
- « Previous Replies
-
- 1
- 2
- Next Replies »