Unlock a world of possibilities! Login now and discover the exclusive benefits awaiting you.
- Qlik Community
- :
- All Forums
- :
- QlikView App Dev
- :
- Re: Calculating Values Ignoring Certain Selections...
- Subscribe to RSS Feed
- Mark Topic as New
- Mark Topic as Read
- Float this Topic for Current User
- Bookmark
- Subscribe
- Mute
- Printer Friendly Page
- Mark as New
- Bookmark
- Subscribe
- Mute
- Subscribe to RSS Feed
- Permalink
- Report Inappropriate Content
Calculating Values Ignoring Certain Selections / Subsets
Hi all
First things first, please be nice as I've very new to QlikView and struggling with what others probably consider basic..
That said I need some help working out some percentages... I have a very large data set which I want to create a summary table for; the user will make selections on different dimensions in the data set and summary results will be shown in the summary table. I want to show a percentage for certain values against the larger data set, however when I try to do this I can't figure out how to calculate the percentage to ignore some of the selections
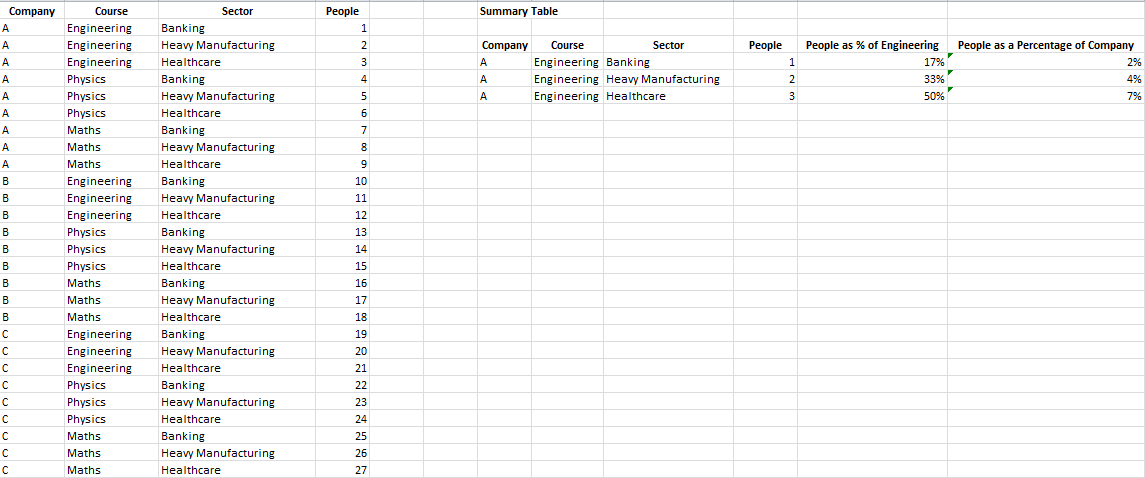
To help explain better I've produced a dummy data set
The left half of the picture is the raw data, the right hand side is the summary table I'm trying to calculate. Imaging a user has selected Company A and Engineering from the relevant dimension boxes. I therefore want to calculate the people in each of the sectors as a percentage of engineering and also as a percentage of company A.
To populate the People column I'm using an expression =sum(People)
To calculate the total population belonging to Company A I think I use =sum(TOTAL <Company> People)
But I'm stumped on how to work out the number of people in the total population belonging to Company A AND Engineering
Thanks in advance
JOhn
- Tags:
- new_to_qlikview
Accepted Solutions
- Mark as New
- Bookmark
- Subscribe
- Mute
- Subscribe to RSS Feed
- Permalink
- Report Inappropriate Content
I am not sure I totally understand but if you want a total by company and course you just need to use
sum(TOTAL <Company, Course> People)
Read "TOTAL <Company, Course>" as group by sums of people BY Company and Course.
This part {$<Company=>} - you need to do that only if you want to disregard what users select in your company list box.
- Mark as New
- Bookmark
- Subscribe
- Mute
- Subscribe to RSS Feed
- Permalink
- Report Inappropriate Content
Hi John,
if you use Company and Course as your dimensions in your chart, QV will slice data for you and break them by these dimensions.
If you want to get specific number for company A and course = Engineering, you would need to use set analysis expressions which you would need to master. There are a lot of examples and tutorials out there on this subject.
Basically if you create a text box on a side in QV and type this expression below, it would give you number of people just for Company A and Engineering:
= SUM ( {$<Company={'CompanyA'},Course={'Engineering'} >} People)
You can also override user selections using set analysis or you can reset user selections. For example, if in your chart you would use sum(TOTAL <Company> People) and user will select CompanyA and CompanyB, your chart will show just these 2 companies. BUT if your expression will be written like
sum(TOTAL <Company> {$<Company=>}People)
it would show all companies still even if user decided not to see all of them.
Hope if makes sense
- Mark as New
- Bookmark
- Subscribe
- Mute
- Subscribe to RSS Feed
- Permalink
- Report Inappropriate Content
Borys
Thanks for your help so far, what you have said makes sense but the problem I have is the size of my data set; I have 200 companies and 12 possible courses so i cannot write down every comobination. The code you suggested to put in the text box worked but I need to put this in the table.
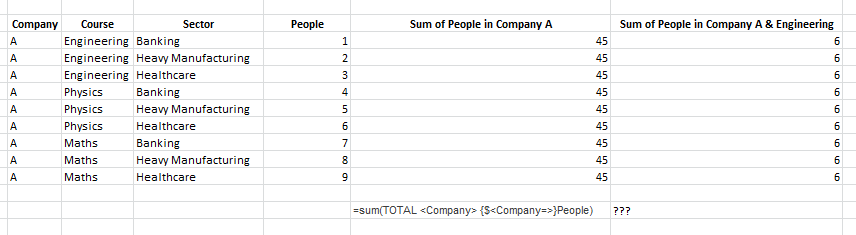
I have added your formula into an expression in my table to give the sum of people by company. What I need to know is how to do an intersection on two dimensions (in this case Company and Course) to get the total people in engineering and company A - i.e. where the ???? are in the image
I plan on using these numbers to calculate percentages of people employed in each discipline and then create a ranking function to priotitise them.
Unfortunately I can't share the main worksheet with teh 200+ companies in it as there is proprietary info there
Thanks
- Mark as New
- Bookmark
- Subscribe
- Mute
- Subscribe to RSS Feed
- Permalink
- Report Inappropriate Content
I am not sure I totally understand but if you want a total by company and course you just need to use
sum(TOTAL <Company, Course> People)
Read "TOTAL <Company, Course>" as group by sums of people BY Company and Course.
This part {$<Company=>} - you need to do that only if you want to disregard what users select in your company list box.
- Mark as New
- Bookmark
- Subscribe
- Mute
- Subscribe to RSS Feed
- Permalink
- Report Inappropriate Content
thank you!!!
As ever the answer is generally straight forward once you see it!!
- Mark as New
- Bookmark
- Subscribe
- Mute
- Subscribe to RSS Feed
- Permalink
- Report Inappropriate Content
I am glad I was able to help and yes the devil in the details 
BTW you mentioned ranking - look up RANK function in QV help file, it might do exactly what you need (or not). Once you have you SUM expression working, you can use RANK function around it.
- Mark as New
- Bookmark
- Subscribe
- Mute
- Subscribe to RSS Feed
- Permalink
- Report Inappropriate Content
Hi Boris,
is there any possible way to achieve the above task using aggr(). I have included the expression below...Will the below expression work ??
=Aggr({1}sum(People),Company)
or