Unlock a world of possibilities! Login now and discover the exclusive benefits awaiting you.
- Qlik Community
- :
- All Forums
- :
- QlikView App Dev
- :
- Re: Can't divide two calculations in chart
- Subscribe to RSS Feed
- Mark Topic as New
- Mark Topic as Read
- Float this Topic for Current User
- Bookmark
- Subscribe
- Mute
- Printer Friendly Page
- Mark as New
- Bookmark
- Subscribe
- Mute
- Subscribe to RSS Feed
- Permalink
- Report Inappropriate Content
Can't divide two calculations in chart
This is extremely weird, or maybe I'm just doing something really simple, really wrong.
Here are two charts. One is total orders, one is total orders with a source of PV.
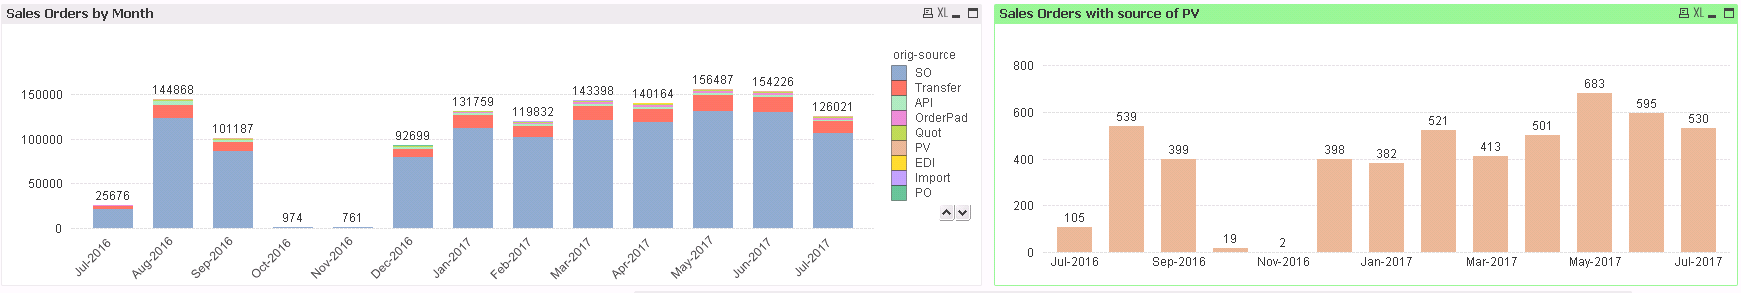
Here are the two expressions.
count(distinct(header_uid))
Count({<[orig-source]={'PV'}>}DISTINCT(header_uid))
I want a chart that shows % of PV Orders from Total orders.
Naturally, I use this.
=Count({<[orig-source]={'PV'}>}DISTINCT(header_uid))
/
count({<[orig-source]= >}distinct(header_uid))
But this is my chart...
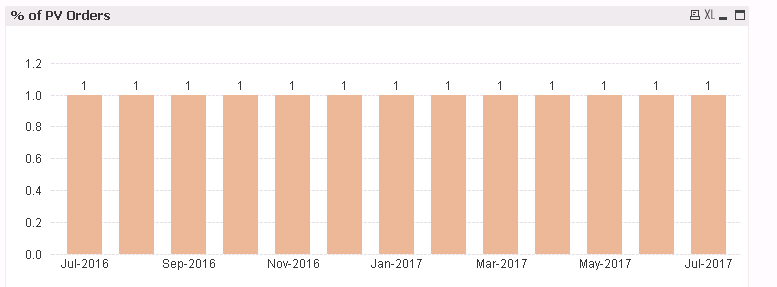
Why?
Accepted Solutions
- Mark as New
- Bookmark
- Subscribe
- Mute
- Subscribe to RSS Feed
- Permalink
- Report Inappropriate Content
Hi Aaron,
Try below expression -
Count({<[Oring-source]={'PV'}>}Distinct Header_Uid)
/
Count(Total Distinct Header_Uid)
- Mark as New
- Bookmark
- Subscribe
- Mute
- Subscribe to RSS Feed
- Permalink
- Report Inappropriate Content
Hi Aaron,
Try below expression -
Count({<[Oring-source]={'PV'}>}Distinct Header_Uid)
/
Count(Total Distinct Header_Uid)
- Mark as New
- Bookmark
- Subscribe
- Mute
- Subscribe to RSS Feed
- Permalink
- Report Inappropriate Content
As Milind wrote, the set analysis in the denominator is useless, because you need to divide in the total count and not the selected count.
- Mark as New
- Bookmark
- Subscribe
- Mute
- Subscribe to RSS Feed
- Permalink
- Report Inappropriate Content
How about this
=Count({<[orig-source]={'PV'}>} DISTINCT header_uid) / Sum(Aggr(Count({<[orig-source]>} DISTINCT header_uid), MonthYearField, [orig-source]))
- Mark as New
- Bookmark
- Subscribe
- Mute
- Subscribe to RSS Feed
- Permalink
- Report Inappropriate Content
Thanks!
- Mark as New
- Bookmark
- Subscribe
- Mute
- Subscribe to RSS Feed
- Permalink
- Report Inappropriate Content
I didn't think of that, thanks
- Mark as New
- Bookmark
- Subscribe
- Mute
- Subscribe to RSS Feed
- Permalink
- Report Inappropriate Content
Thanks!