Unlock a world of possibilities! Login now and discover the exclusive benefits awaiting you.
- Qlik Community
- :
- All Forums
- :
- QlikView App Dev
- :
- Re: Can you show the detail of what was filtered o...
- Subscribe to RSS Feed
- Mark Topic as New
- Mark Topic as Read
- Float this Topic for Current User
- Bookmark
- Subscribe
- Mute
- Printer Friendly Page
- Mark as New
- Bookmark
- Subscribe
- Mute
- Subscribe to RSS Feed
- Permalink
- Report Inappropriate Content
Can you show the detail of what was filtered out?
Hello,
Is it possible to show the detail for those who were filtered out of a group? This is for a Penetration report. The client wants to see, in a market, who is not receiving the product. So the product needs to be selected shown that they are not receiving it. However, it needs to be shown with those who did receive it.
Example Data:
| Area | City | Marble |
|---|---|---|
| East | Atlanta | Red |
| East | Boston | Red |
| East | Hartford | Red |
| East | Jacksonville | Blue |
| East | New York | Blue |
| East | Providence | Red |
| West | Los Angeles | Red |
| West | Los Angeles | Blue |
| West | Phoenix | Red |
| West | Phoenix | Blue |
| West | Sacramento | Red |
| West | Sacramento | Blue |
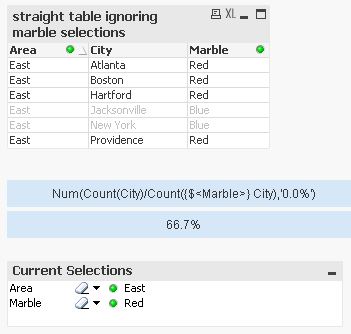
For example, I first filter the data to see only the East - Atlanta, Boston, Hartford, Jacksonville, New York and Providence.
Then I filter further to just see those who have Red marbles. That leaves me with Atlanta, Boston, Hartford and Providence. Even though it is just the Red marbles, I want to see all the East Area cities to get those cities. Then I can do a penetration percent (6 / 4 = 66.7%). The client also wants to see these individuals to export to Excel.
The only way I think I can express this, is that it is like filtering down to a point, and then freezing the filter, then filter further but not losing that group. Those who are "extra filtered" remain visible, but highlighted or something like that.
Does that make any sense?
Thank you for the help.
p.s. What IT's solution has been is to get all the possible products and then add them to each city and add a flag if they actually got the marble or if it is a faked row. The problem is the data has become enormous (Cartesian join!) and they can only load about a year or two worth of data. That does not seem like a good idea to me.
Accepted Solutions
- Mark as New
- Bookmark
- Subscribe
- Mute
- Subscribe to RSS Feed
- Permalink
- Report Inappropriate Content
Hi,
glad it helped.
I used this Text Color function for all dimensions:
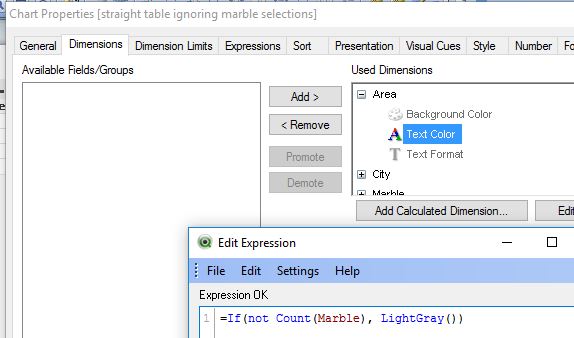
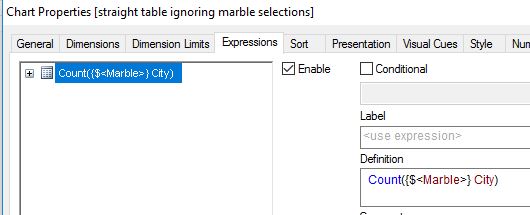
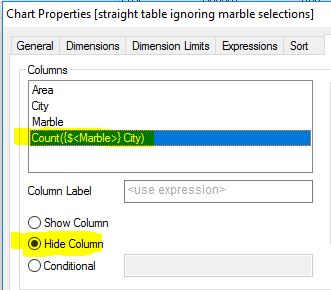
Note that this only formats the text while ignoring the Marble field selections is done using the set expression {$<Marble>}.
Please take some time and close this thread if your question is answered:
Qlik Community Tip: Marking Replies as Correct or Helpful
Thanks
regards
Marco
- Mark as New
- Bookmark
- Subscribe
- Mute
- Subscribe to RSS Feed
- Permalink
- Report Inappropriate Content
- Mark as New
- Bookmark
- Subscribe
- Mute
- Subscribe to RSS Feed
- Permalink
- Report Inappropriate Content
Hi,
maybe one solution could be:
hope this helps
regards
Marco
- Mark as New
- Bookmark
- Subscribe
- Mute
- Subscribe to RSS Feed
- Permalink
- Report Inappropriate Content
Hi Marco,
Thank you so much for this! It appears to be the perfect solution I was looking for.
Would you mind giving me more information about how you got the non-selected rows to grey-out instead of being filtered out? I was looking at the QVW you provided, but I cannot seem to figure it out.
I really appreciate you taking the time to provide this answer to me. It is such a great help.
- Mark as New
- Bookmark
- Subscribe
- Mute
- Subscribe to RSS Feed
- Permalink
- Report Inappropriate Content
Rupam,
I appreciate you sending the link, it is very helpful.
- Mark as New
- Bookmark
- Subscribe
- Mute
- Subscribe to RSS Feed
- Permalink
- Report Inappropriate Content
Hi,
glad it helped.
I used this Text Color function for all dimensions:
Note that this only formats the text while ignoring the Marble field selections is done using the set expression {$<Marble>}.
Please take some time and close this thread if your question is answered:
Qlik Community Tip: Marking Replies as Correct or Helpful
Thanks
regards
Marco
- Mark as New
- Bookmark
- Subscribe
- Mute
- Subscribe to RSS Feed
- Permalink
- Report Inappropriate Content
Marco,
This is a huge help for me. I really appreciate you taking the time to respond with such great information. You saved me a great deal of time (and aggravation).