Unlock a world of possibilities! Login now and discover the exclusive benefits awaiting you.
- Qlik Community
- :
- All Forums
- :
- QlikView App Dev
- :
- Change field parameter in Scatter chart without ch...
- Subscribe to RSS Feed
- Mark Topic as New
- Mark Topic as Read
- Float this Topic for Current User
- Bookmark
- Subscribe
- Mute
- Printer Friendly Page
- Mark as New
- Bookmark
- Subscribe
- Mute
- Subscribe to RSS Feed
- Permalink
- Report Inappropriate Content
Change field parameter in Scatter chart without changing the field
Hello,
How can I change the x-axis parameter value, without changing the content of the field, but only in order to choose a value with fewer decimals to be considered in the scatter chart.
The scatter chart quickly finds all combinations between my x and y parameters, but the x-parameter has a numerical value with 2 decimals, and I only want to compare the values with 1 decimal in the scatter chart instead, without effecting all the other selections including the field itself. How can I do that?
- « Previous Replies
-
- 1
- 2
- Next Replies »
- Mark as New
- Bookmark
- Subscribe
- Mute
- Subscribe to RSS Feed
- Permalink
- Report Inappropriate Content
Can you help us to understand the query and please highlight the one where we are looking?
- Mark as New
- Bookmark
- Subscribe
- Mute
- Subscribe to RSS Feed
- Permalink
- Report Inappropriate Content
Anil,
There are 2 type of parameters, let us call them risk and potential gain.
The risk parameter in the scatter chart uses 2 decimals, i.e. 2.34, 2.45, 2.56, etc... the other parameter is an integer.
Now I want to see all possible results based on a more narrow set of possibilities where the risk parameter uses only 1 decimal and not 2, i.e. 2.3, 2.4, 2.6, etc...
Then the expression would not be able to use as many possible values for the risk parameter, because it has only 10 possible values between each 1 integer value instead of 100 possibilities. As an example:
Risk 2.2 x n (potential gian), 2.3 x n (potential gain), 2.4 x n (potential gian), etc... instead of 2.21 x n (potential gain), 2.22 x n (potential gain), etc....
I basically want to narrow down the possible outcomes by limiting the risk parameter into bigger chunks.
I would also want to try to change the risk parameter to even bigger steps like:
2.0, 2.5, 3.0, 3.5, 4.0 instead of 2.1, 2.2, 2.3, 2.4 or as it is now 2.01, 2.02, 2.03, 2.04, 2.05, 2.06, etc etc etc...
Hope this is clearer?
- Mark as New
- Bookmark
- Subscribe
- Mute
- Subscribe to RSS Feed
- Permalink
- Report Inappropriate Content
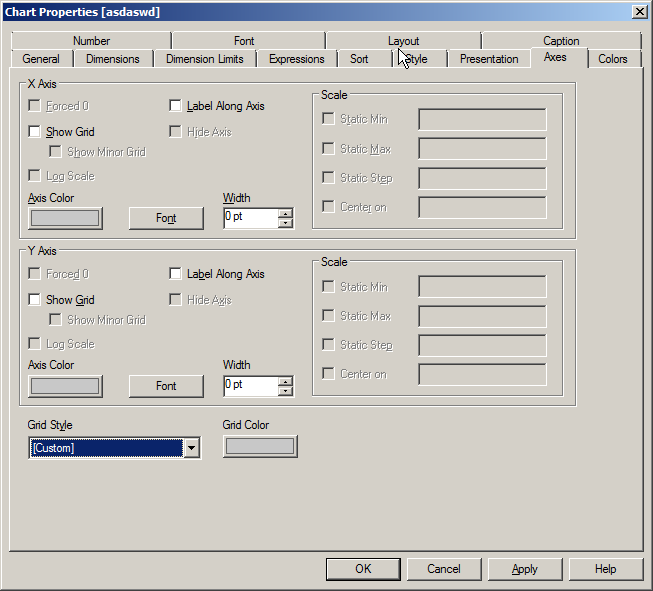
What does "n" indicates which as "potential". And i feel you are expecting scale concept. I would ask you to check over Axes tab for X-axis
- Mark as New
- Bookmark
- Subscribe
- Mute
- Subscribe to RSS Feed
- Permalink
- Report Inappropriate Content
I can not activate these settings for some reason.
- Mark as New
- Bookmark
- Subscribe
- Mute
- Subscribe to RSS Feed
- Permalink
- Report Inappropriate Content
Anil,
>What does "n" indicates which as "potential". And i feel you are expecting scale concept.
On the x-axis I am using a risk parameter that has to many possibilities, due to the decimal factor. I want to limit the amount of possible potential values (n), by limiting the steps. I think you are on the right track with the x-axis static step idea, but its a bit unfortunate that it is not working atm.
- Mark as New
- Bookmark
- Subscribe
- Mute
- Subscribe to RSS Feed
- Permalink
- Report Inappropriate Content
How many dimensions and expressions you have? To enable Scale options it should be 2 dims/expressions required
- Mark as New
- Bookmark
- Subscribe
- Mute
- Subscribe to RSS Feed
- Permalink
- Report Inappropriate Content
- Mark as New
- Bookmark
- Subscribe
- Mute
- Subscribe to RSS Feed
- Permalink
- Report Inappropriate Content
2 dims, 1 expression (for the bubble size)
- Mark as New
- Bookmark
- Subscribe
- Mute
- Subscribe to RSS Feed
- Permalink
- Report Inappropriate Content
Hi Rob,
This was the solution to what I thought was my initial problem, thanks Rob.
But I now see that it is not entirely the solution to what I want to achieve:
I have 3 parameters, each one of them deals with an intervall of values.
Maximum Risk.
Minimum Parameter1.
Minimum Parameter2.
When I limit the amount of possibilities to changing Risk to 2 decimals, I get indeed fewer possibilities, but only for instances of all 3 parameters, and not with the interval ranges. What I mean by this is that the optimal solution only works for when Risk is exactly 3.5 and not >3.5, same applies to Parameter1 and Parameter2.
Is there any intelligent way to show the sum(calculation) for these 3 parameters including an entire set of their values and not just a point value?
Let me know if I need to explain a bit better.
- « Previous Replies
-
- 1
- 2
- Next Replies »