Unlock a world of possibilities! Login now and discover the exclusive benefits awaiting you.
- Qlik Community
- :
- All Forums
- :
- QlikView App Dev
- :
- Chart Dimension-Fiscal Calendar
- Subscribe to RSS Feed
- Mark Topic as New
- Mark Topic as Read
- Float this Topic for Current User
- Bookmark
- Subscribe
- Mute
- Printer Friendly Page
- Mark as New
- Bookmark
- Subscribe
- Mute
- Subscribe to RSS Feed
- Permalink
- Report Inappropriate Content
Chart Dimension-Fiscal Calendar
Hi All,
I have two dates: subscription start and subscription end.Each Quote is associated with a subscription start and end date and with an account.
Example:
Quote: 1234
Subscription start date=06/13/2016
Subscription end date=6/14/2017
Account=XYZ
Fiscal Year 2017 is from Oct 1st 2016-Sep 29th 2017.
I need my line chart to show all the active accounts(based on expression) for this fiscal year by month.
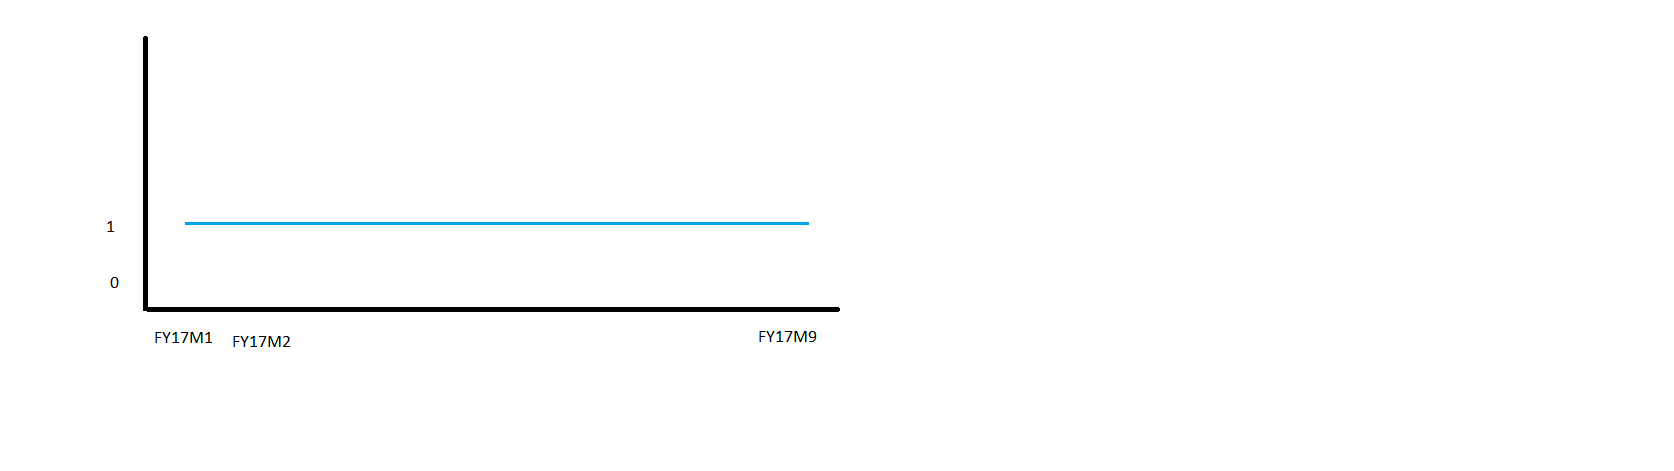
So basically if I select Quote 1234, it will display the chart below(since the start date is before the start of FY17, the account has been active from Oct 2017 till June 2017)
Expression used: count({<Flag1={'negative'},nullflag={'1'}>}distinct(AccountName))
Similarly if there was another quote(different account) with same start date and end date=3/25/2017, then the chart would have shown count as 2 for all the fiscal months till FY17M6(since 2 accounts are active) and 1 for the rest.
How do I create the dimension?
- Mark as New
- Bookmark
- Subscribe
- Mute
- Subscribe to RSS Feed
- Permalink
- Report Inappropriate Content
I am not understand fully, Would you share the application
- Mark as New
- Bookmark
- Subscribe
- Mute
- Subscribe to RSS Feed
- Permalink
- Report Inappropriate Content
I cannot share the application. Basically I want to show all the months a quote/account has been active between the subscription start date and subscription end date in the dimension. If the subscription end date has been reached then the account won't show from the next month.