Unlock a world of possibilities! Login now and discover the exclusive benefits awaiting you.
- Qlik Community
- :
- All Forums
- :
- QlikView App Dev
- :
- Re: Chart Formatting
Options
- Subscribe to RSS Feed
- Mark Topic as New
- Mark Topic as Read
- Float this Topic for Current User
- Bookmark
- Subscribe
- Mute
- Printer Friendly Page
Turn on suggestions
Auto-suggest helps you quickly narrow down your search results by suggesting possible matches as you type.
Showing results for
Anonymous
Not applicable
2017-08-07
10:38 AM
- Mark as New
- Bookmark
- Subscribe
- Mute
- Subscribe to RSS Feed
- Permalink
- Report Inappropriate Content
Chart Formatting
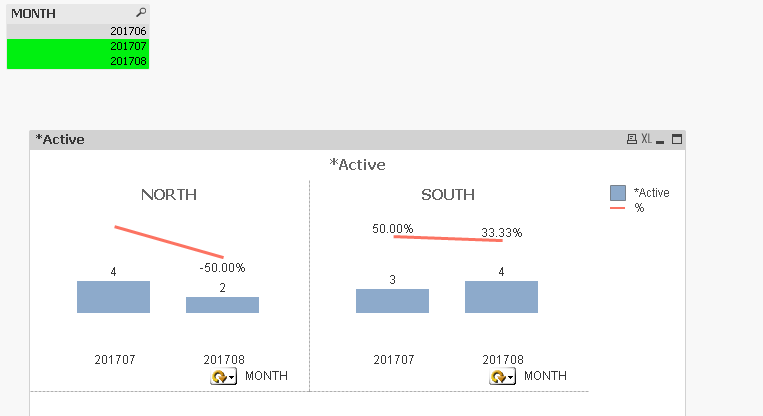
I have the below chart. There will be a trigger on the page that shows the max 2 months. What I would like to do is show the lattest two months but also show for my % dimension the last three months. So for example. the line graph would show the % for month 201706,201707 & 201708. (Visually I think that looks better)
The requestor would like to be able to filter on month when needed.
Like below but only showing two months and not three.
601 Views
3 Replies
2017-08-07
10:57 AM
- Mark as New
- Bookmark
- Subscribe
- Mute
- Subscribe to RSS Feed
- Permalink
- Report Inappropriate Content
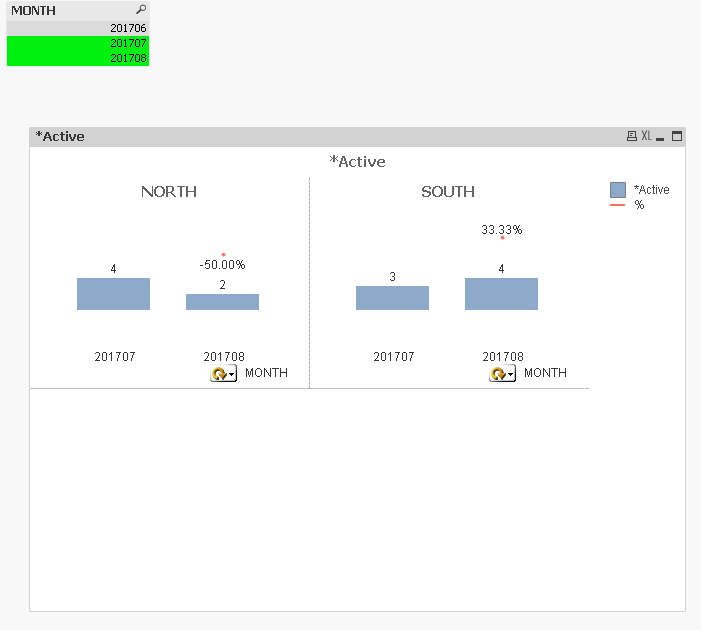
Like this?

Best Anil, When applicable please mark the correct/appropriate replies as "solution" (you can mark up to 3 "solutions". Please LIKE threads if the provided solution is helpful
Anonymous
Not applicable
2017-08-07
01:11 PM
Author
- Mark as New
- Bookmark
- Subscribe
- Mute
- Subscribe to RSS Feed
- Permalink
- Report Inappropriate Content
Yes and I can still use the Month slicer? If so, can you attached the sample app?
510 Views
MVP
2017-08-07
01:18 PM
- Mark as New
- Bookmark
- Subscribe
- Mute
- Subscribe to RSS Feed
- Permalink
- Report Inappropriate Content
Try this
Num(Count({<STATUS = {"1"} >} ID)/
Above(Count({<STATUS= {"1"}, MONTH>} ID), 1) - 1, '#.00%')