Unlock a world of possibilities! Login now and discover the exclusive benefits awaiting you.
- Qlik Community
- :
- All Forums
- :
- QlikView App Dev
- :
- Chart Line to change colour
- Subscribe to RSS Feed
- Mark Topic as New
- Mark Topic as Read
- Float this Topic for Current User
- Bookmark
- Subscribe
- Mute
- Printer Friendly Page
- Mark as New
- Bookmark
- Subscribe
- Mute
- Subscribe to RSS Feed
- Permalink
- Report Inappropriate Content
Chart Line to change colour
Hi,
I can have the following chart:
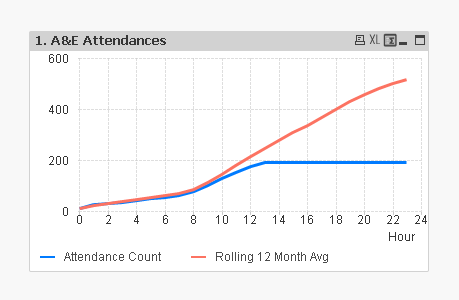
From 14.00 hours I want the blue line to go white.
I've tried to write the following expression for the Background Colour, but it doesnt change anything.
if (Hour>'14', RGB (255,255,255), RGB(0,123,255))
Any ideas folks?
Thanks.
- Tags:
- new_to_qlikview
- « Previous Replies
-
- 1
- 2
- Next Replies »
- Mark as New
- Bookmark
- Subscribe
- Mute
- Subscribe to RSS Feed
- Permalink
- Report Inappropriate Content
May be try as below
if (Hour>14, RGB (255,255,255), RGB(0,123,255))
or what is the format of your Hour?
- Mark as New
- Bookmark
- Subscribe
- Mute
- Subscribe to RSS Feed
- Permalink
- Report Inappropriate Content
Syntax looks okay, the only thing you need to check the format compatibility.
Make sure Format of Hour and 14 should be same
- Mark as New
- Bookmark
- Subscribe
- Mute
- Subscribe to RSS Feed
- Permalink
- Report Inappropriate Content
How can I get the format to be the same?
Thanks
- Mark as New
- Bookmark
- Subscribe
- Mute
- Subscribe to RSS Feed
- Permalink
- Report Inappropriate Content
Hi deep,
your syntax is correct,
if possible to share your date field values
- Mark as New
- Bookmark
- Subscribe
- Mute
- Subscribe to RSS Feed
- Permalink
- Report Inappropriate Content
Hi, from the straigth line after '14' seems that expression is full accumulated and there is no data for hour>14 so it keeps the last value, maybe using:
if (Hour>14 or IsNull(Hour), RGB (255,255,255), RGB(0,123,255))
- Mark as New
- Bookmark
- Subscribe
- Mute
- Subscribe to RSS Feed
- Permalink
- Report Inappropriate Content
No it didnt work 
- Mark as New
- Bookmark
- Subscribe
- Mute
- Subscribe to RSS Feed
- Permalink
- Report Inappropriate Content
Hi,
Try like this ,
Expand your expression ->Select Background Color->if (Hour>=14, RGB (255,255,255), RGB(0,123,255)).
I tried in my app as per my requirement. Please you try with your values.
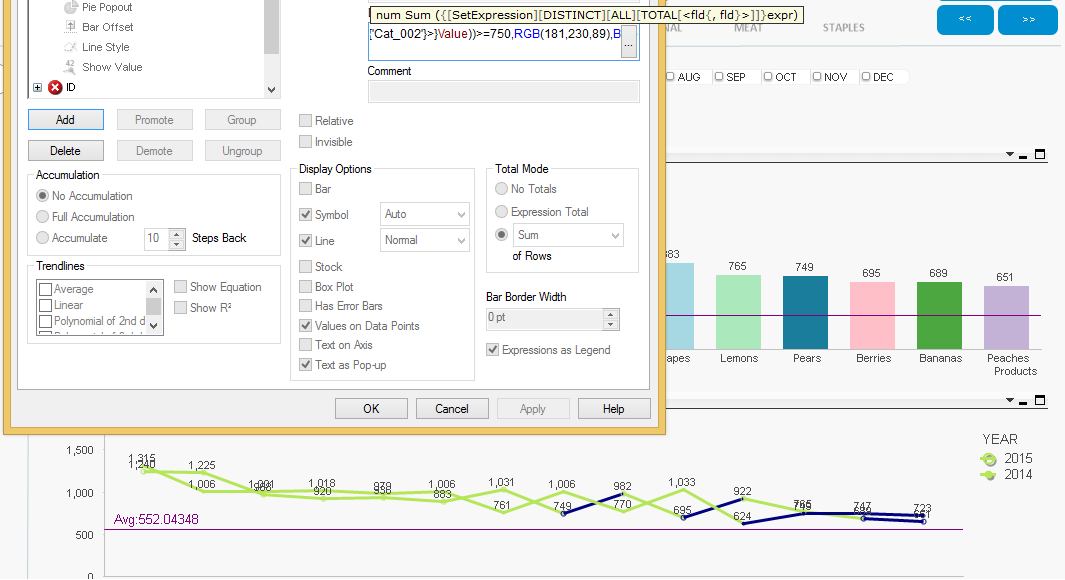
Edited : My experession is like this
=if((Sum({<Category_ID={'Cat_002'}>}Value))>=750,RGB(181,230,89),Blue()).
- Mark as New
- Bookmark
- Subscribe
- Mute
- Subscribe to RSS Feed
- Permalink
- Report Inappropriate Content
Define vHour as
=Time#('13','hh')*24
Dimension
=Floor(Frac([Arrival DateTime])*24)
Use below expression for color
IF(Floor(Frac([Arrival DateTime])*24)>=vHour,White(),Green())
Change Green() to whatever colour want.
- Mark as New
- Bookmark
- Subscribe
- Mute
- Subscribe to RSS Feed
- Permalink
- Report Inappropriate Content
- « Previous Replies
-
- 1
- 2
- Next Replies »