Unlock a world of possibilities! Login now and discover the exclusive benefits awaiting you.
- Qlik Community
- :
- All Forums
- :
- QlikView App Dev
- :
- Chart- Straight table: Not all the Expression valu...
- Subscribe to RSS Feed
- Mark Topic as New
- Mark Topic as Read
- Float this Topic for Current User
- Bookmark
- Subscribe
- Mute
- Printer Friendly Page
- Mark as New
- Bookmark
- Subscribe
- Mute
- Subscribe to RSS Feed
- Permalink
- Report Inappropriate Content
Chart- Straight table: Not all the Expression values (Corresponds to a dimension) are displayed.
I'm using a Chart (Straight table)- I have few Dimensions and few Expressions.
Now, If the values of the Dimensions are the same and corresponding expressions are different then I don't see those values:
For example:
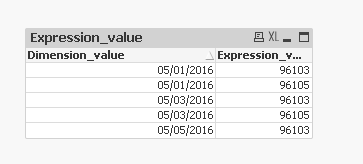
Result should be like this:
Dimension_value Expression_value
05/01/2016 96103
05/01/2016 96105
05/03/2016 96103
05/03/2016 96105
05/05/2016 96103
But I get the result like this:
Dimension_value Expression_value
05/01/2016 -
05/03/2016 -
05/05/2016 96103
It combines values instead of displaying all values.
Do anyone have the solution for this?
- Mark as New
- Bookmark
- Subscribe
- Mute
- Subscribe to RSS Feed
- Permalink
- Report Inappropriate Content
You might need to add another dimension which makes the expression_value unique for each row. Do you have such a field available in your database?
- Mark as New
- Bookmark
- Subscribe
- Mute
- Subscribe to RSS Feed
- Permalink
- Report Inappropriate Content
Okay, I thought the same way! I need to find the unique key. Since We are building the table dynamically we don't need this "Expression value" always. So, I'm trying to find the uniquely value which applies for all possible column selections (Dynamic).
Is There any other way?
- Mark as New
- Bookmark
- Subscribe
- Mute
- Subscribe to RSS Feed
- Permalink
- Report Inappropriate Content
Do the Dual Function in your script.See attached.
Output:
- Mark as New
- Bookmark
- Subscribe
- Mute
- Subscribe to RSS Feed
- Permalink
- Report Inappropriate Content
This is a good idea too.. Thanks
- Mark as New
- Bookmark
- Subscribe
- Mute
- Subscribe to RSS Feed
- Permalink
- Report Inappropriate Content
If you dont have any unique key, you can use dual function else usage of unique key is preferred.