Unlock a world of possibilities! Login now and discover the exclusive benefits awaiting you.
- Qlik Community
- :
- All Forums
- :
- QlikView App Dev
- :
- Chart: multiple dimensions
- Subscribe to RSS Feed
- Mark Topic as New
- Mark Topic as Read
- Float this Topic for Current User
- Bookmark
- Subscribe
- Mute
- Printer Friendly Page
- Mark as New
- Bookmark
- Subscribe
- Mute
- Subscribe to RSS Feed
- Permalink
- Report Inappropriate Content
Chart: multiple dimensions
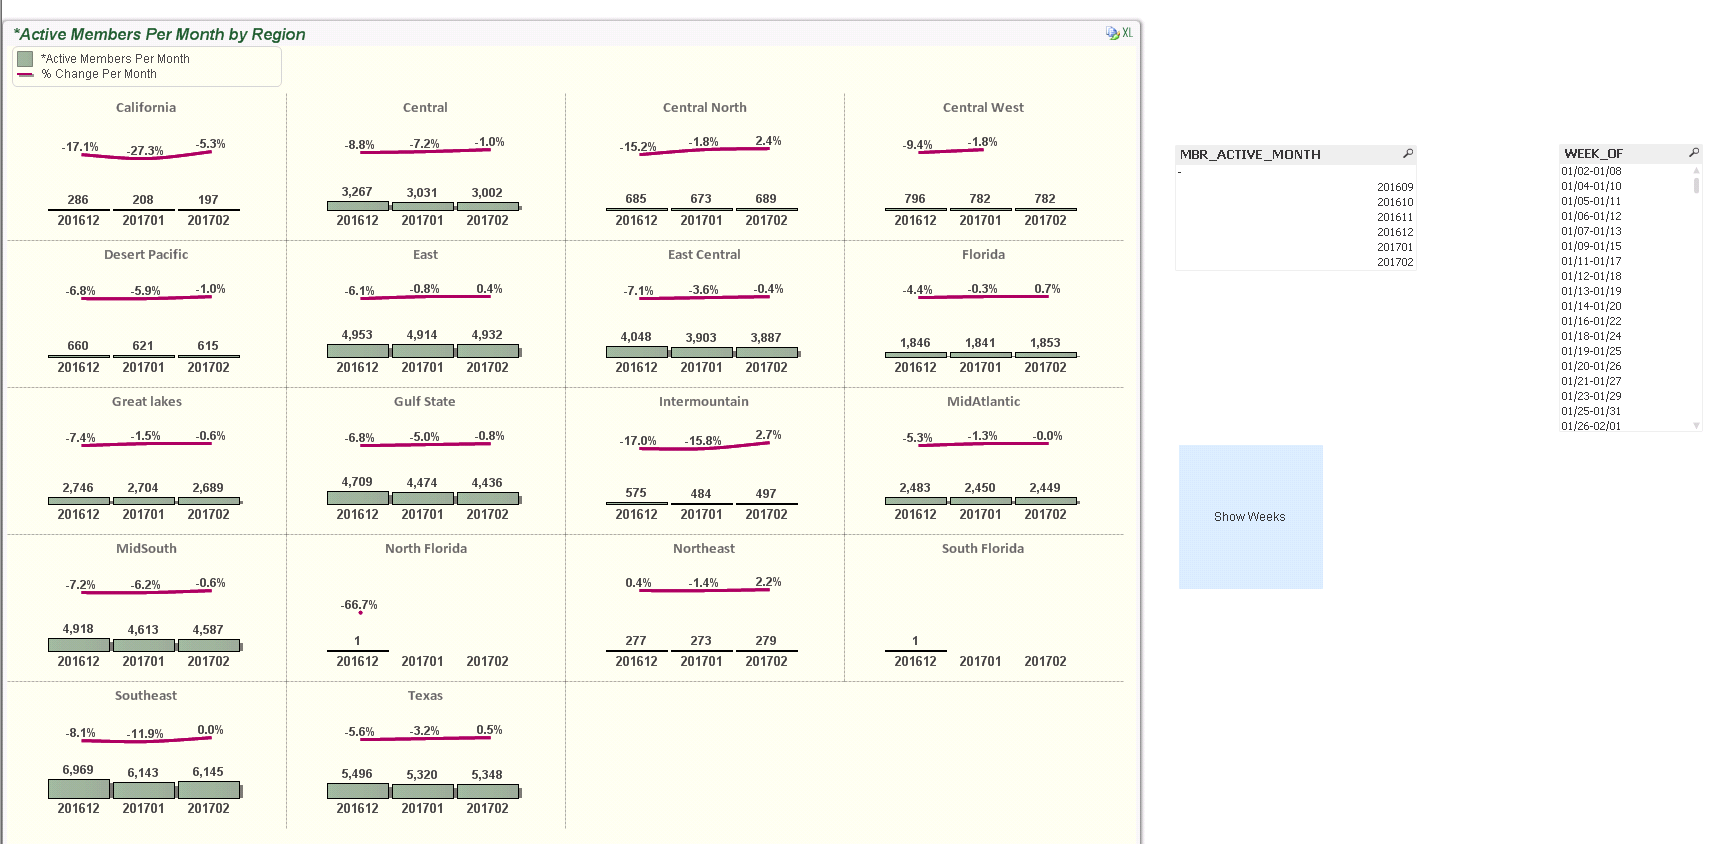
I have the attached chart and also a screenshot below.
I would like to create a cyclic chart for Month and Week_Of. I just need to add a Week_of dimension that matches the formatting below. So, only show the last 3 of week_of values.
I've tried using a variable and cyclic but can't seem to get the Week_of dimension correct. Any help would be appreciated.
- Mark as New
- Bookmark
- Subscribe
- Mute
- Subscribe to RSS Feed
- Permalink
- Report Inappropriate Content
any ideas
- Mark as New
- Bookmark
- Subscribe
- Mute
- Subscribe to RSS Feed
- Permalink
- Report Inappropriate Content
A solution might be to use a cyclic group to switch between the dimensions whereby in your case a cyclic group directly in the chart would distort the layout and would be better to place the switch on the outside maybe within a listbox (they could be adjusted and overlapping the chart on an appropriate place) and the chart grabed the dimension per getcurrentfield().
Your approach to get the last or certain dimension-fields each will need some adjustments preferable with a flag within the script, maybe with something like:
autonumber(YearMonth) as PeriodID
autonumber(Week_of) as WeekID
within a sorted master-calendar and than an expression like:
count({< PeriodID = {">=$(max(PeriodID)-3)"}>} MBR_ACTIVE_CLT_CLT_PGMID)
- Marcus
- Mark as New
- Bookmark
- Subscribe
- Mute
- Subscribe to RSS Feed
- Permalink
- Report Inappropriate Content
You can try something like this for most recent three weeks.
count({$<Datefield= {"$(='>=' & date(weekstart(today())-28))"}>}active members)
Replace weekstart(today) with month start if u r looking at last 3 months
count({$<Datefield= {"$(='>=' & date(Monthstart(today())-3))"}>}active members)