Unlock a world of possibilities! Login now and discover the exclusive benefits awaiting you.
- Qlik Community
- :
- All Forums
- :
- QlikView App Dev
- :
- Re: Chart settings, adding value on data points
- Subscribe to RSS Feed
- Mark Topic as New
- Mark Topic as Read
- Float this Topic for Current User
- Bookmark
- Subscribe
- Mute
- Printer Friendly Page
- Mark as New
- Bookmark
- Subscribe
- Mute
- Subscribe to RSS Feed
- Permalink
- Report Inappropriate Content
Chart settings, adding value on data points
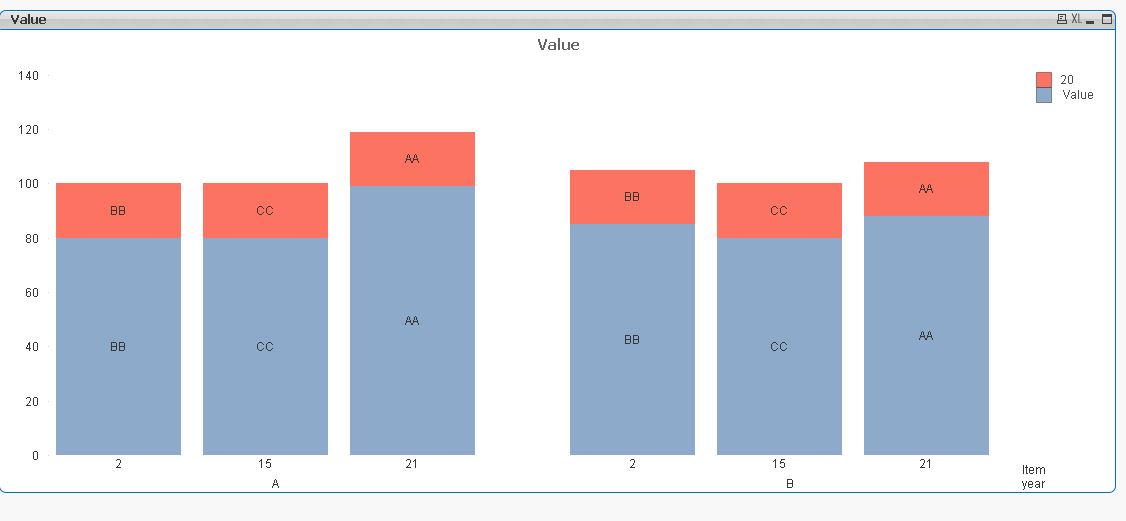
I have a 2 dimension bar chart with 2 expressions.
The expression values are stacked since it has 2 dimension.
I want to display a custom text inside the bars, but only for one of the bars.
When i enable plot data values inside segment, it adds it to both bars, is there a way to make it show only on one of the bar values ?
sample:
I want the text to show only on the red bars.
- « Previous Replies
- Next Replies »
- Mark as New
- Bookmark
- Subscribe
- Mute
- Subscribe to RSS Feed
- Permalink
- Report Inappropriate Content
Would you mind upgrading to 11.20 SR4 (last one)?
- Mark as New
- Bookmark
- Subscribe
- Mute
- Subscribe to RSS Feed
- Permalink
- Report Inappropriate Content
ok, will try
- Mark as New
- Bookmark
- Subscribe
- Mute
- Subscribe to RSS Feed
- Permalink
- Report Inappropriate Content
That´s the version I´m using right now
- Mark as New
- Bookmark
- Subscribe
- Mute
- Subscribe to RSS Feed
- Permalink
- Report Inappropriate Content
OK! that solved the problem!
Thanks, would have never figure this out by myself.
So technically, the first person that replied gave the right answer, but just never worked with my version of the software.
- Mark as New
- Bookmark
- Subscribe
- Mute
- Subscribe to RSS Feed
- Permalink
- Report Inappropriate Content
You´re welcome
- « Previous Replies
- Next Replies »