Unlock a world of possibilities! Login now and discover the exclusive benefits awaiting you.
- Qlik Community
- :
- All Forums
- :
- QlikView App Dev
- :
- Chart year comparison
- Subscribe to RSS Feed
- Mark Topic as New
- Mark Topic as Read
- Float this Topic for Current User
- Bookmark
- Subscribe
- Mute
- Printer Friendly Page
- Mark as New
- Bookmark
- Subscribe
- Mute
- Subscribe to RSS Feed
- Permalink
- Report Inappropriate Content
Chart year comparison
Hi,
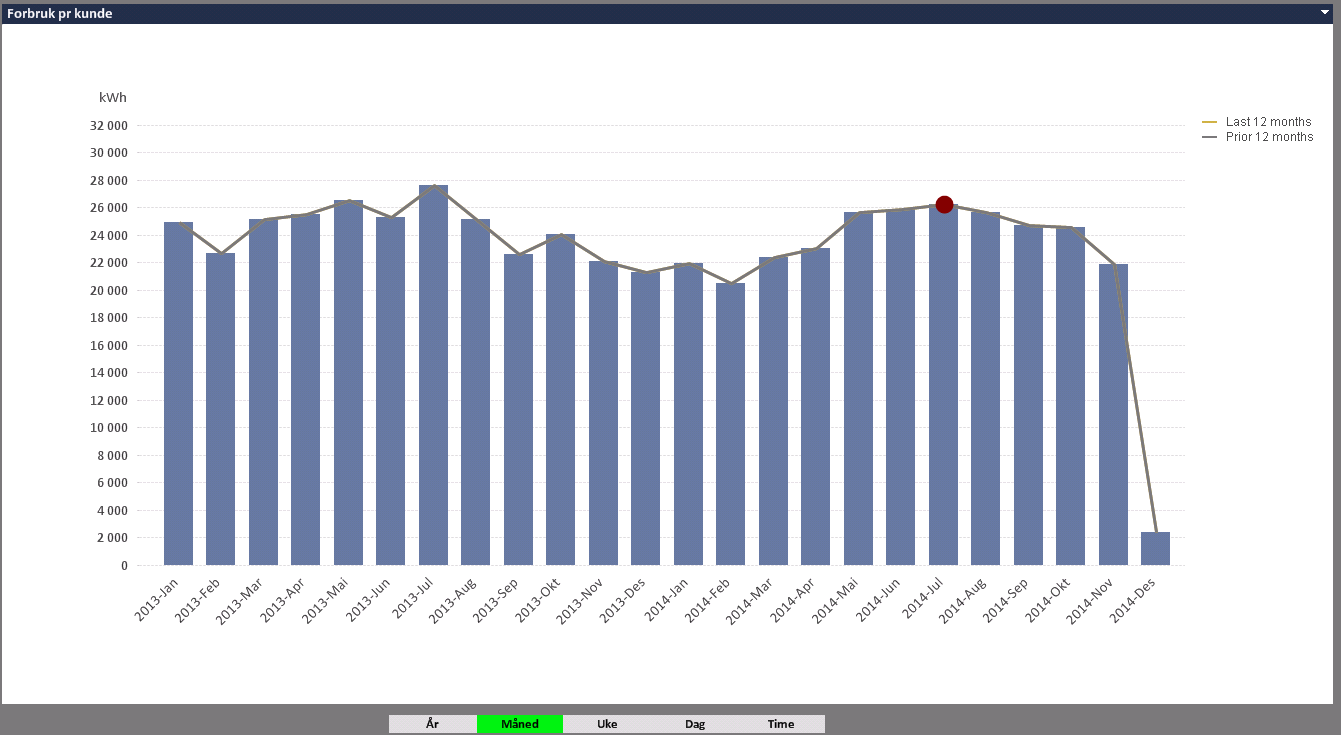
se attached image.
How can I get the columns to compare month by month, for example:
2013-Jan 2014 Jan | 2013 February 2014-February | 2013 March 2014-March | ....
insted of
2013 January 2013-February 2013-March 2014-April
- Mark as New
- Bookmark
- Subscribe
- Mute
- Subscribe to RSS Feed
- Permalink
- Report Inappropriate Content
- Mark as New
- Bookmark
- Subscribe
- Mute
- Subscribe to RSS Feed
- Permalink
- Report Inappropriate Content
Hi,
Can you post some data?
Thanks
PM
- Mark as New
- Bookmark
- Subscribe
- Mute
- Subscribe to RSS Feed
- Permalink
- Report Inappropriate Content
Hi Marius,
You can make 2 flags on your Date Field, Current_Year & Previous_Year. You then create 2 expression using the flags in SET Analysis.
an example is on the below link
Qlikview how to:
http://community.qlik.com/docs/DOC-5486
look into "Set Analysis" tab, "Rolling 12 Mths Using Flags" chart
- Mark as New
- Bookmark
- Subscribe
- Mute
- Subscribe to RSS Feed
- Permalink
- Report Inappropriate Content
It didnt work...
Under the columns you see the problem, it shows January 2013 - Des 2014.
I want it to show January 2013 - January 2014 - February 2013 - February 2014 - March 2013 - March 2014
- Mark as New
- Bookmark
- Subscribe
- Mute
- Subscribe to RSS Feed
- Permalink
- Report Inappropriate Content
If I understand it correctly, you want to sort the bars.
Sort by expression :
Match(MonthYear,'Jan-2013','Jan-2014','Feb-2013','Feb-2014'...)
- Mark as New
- Bookmark
- Subscribe
- Mute
- Subscribe to RSS Feed
- Permalink
- Report Inappropriate Content
Create below this in your calendar script the bring YearFormat in Dimension
Date(MonthName(Date),'YYYY-MMM')&'-'&Date(MonthName(AddMonths(Date,12)),'YYYY-MMM') as YearFormat