Unlock a world of possibilities! Login now and discover the exclusive benefits awaiting you.
- Qlik Community
- :
- All Forums
- :
- QlikView App Dev
- :
- Re: Chart
Options
- Subscribe to RSS Feed
- Mark Topic as New
- Mark Topic as Read
- Float this Topic for Current User
- Bookmark
- Subscribe
- Mute
- Printer Friendly Page
Turn on suggestions
Auto-suggest helps you quickly narrow down your search results by suggesting possible matches as you type.
Showing results for
Anonymous
Not applicable
2018-07-19
02:31 PM
- Mark as New
- Bookmark
- Subscribe
- Mute
- Subscribe to RSS Feed
- Permalink
- Report Inappropriate Content
Chart
Hi guys,
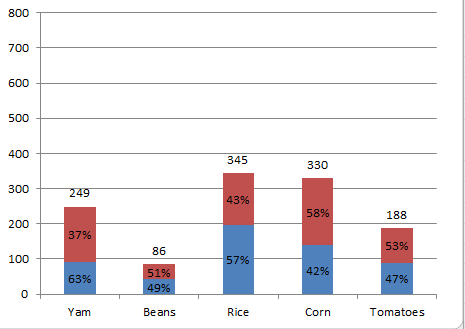
Please how do I make this look like this:
616 Views
5 Replies
Anonymous
Not applicable
2018-07-19
02:33 PM
Author
- Mark as New
- Bookmark
- Subscribe
- Mute
- Subscribe to RSS Feed
- Permalink
- Report Inappropriate Content
I forgot to add the data
513 Views
Partner - Creator II
2018-07-19
03:50 PM
- Mark as New
- Bookmark
- Subscribe
- Mute
- Subscribe to RSS Feed
- Permalink
- Report Inappropriate Content
Hi Peter,
please attach the excel document
513 Views
Specialist III
2018-07-19
04:59 PM
- Mark as New
- Bookmark
- Subscribe
- Mute
- Subscribe to RSS Feed
- Permalink
- Report Inappropriate Content
Hi Peter, you can achieve this with overlapping two charts.
Chart 1 : for display % , unchek bar and check display value on data point/ Presentation tab, check "Value inside bar"
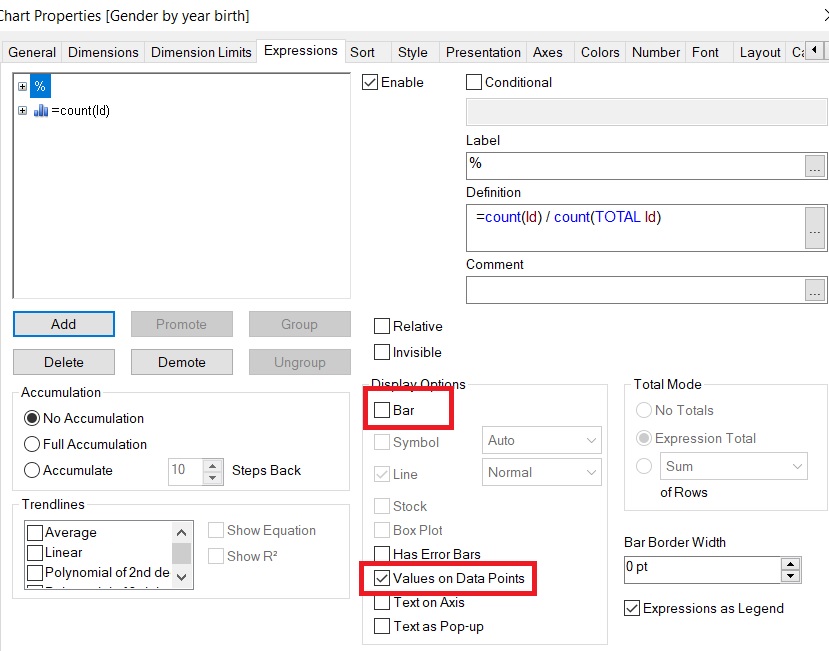
Chart 2 : for display Nb, check display value on data point.
See the sample in attached .qvw
Anonymous
Not applicable
2018-07-20
03:26 AM
Author
- Mark as New
- Bookmark
- Subscribe
- Mute
- Subscribe to RSS Feed
- Permalink
- Report Inappropriate Content
| GROUP | Eaten | Not Eaten | total |
| Yam | 92 | 157 | 249 |
| Beans | 42 | 44 | 86 |
| Rice | 197 | 148 | 345 |
| Corn | 139 | 191 | 330 |
| Tomatoes | 89 | 99 | 188 |
513 Views
Partner - Creator II
2018-07-20
09:43 AM
- Mark as New
- Bookmark
- Subscribe
- Mute
- Subscribe to RSS Feed
- Permalink
- Report Inappropriate Content
Hi Peter, look the qvw...
If it solves your problem, please mark how the correct answer.
good lucky !
513 Views