Unlock a world of possibilities! Login now and discover the exclusive benefits awaiting you.
- Qlik Community
- :
- All Forums
- :
- QlikView App Dev
- :
- Combine fields from two tables to set Chart's para...
- Subscribe to RSS Feed
- Mark Topic as New
- Mark Topic as Read
- Float this Topic for Current User
- Bookmark
- Subscribe
- Mute
- Printer Friendly Page
- Mark as New
- Bookmark
- Subscribe
- Mute
- Subscribe to RSS Feed
- Permalink
- Report Inappropriate Content
Combine fields from two tables to set Chart's parameter
I have 2 tables like following.
| Engine | Year | Temperature 1 | Temperature 2 |
|---|---|---|---|
| A | 2011 | -6 | 13 |
| A | 2012 | -7 | 25 |
| B | 2011 | -3 | 8 |
| B | 2012 | -2 | 12 |
| Position | Parameter |
|---|---|
| Position1 | Temperature1 |
| Position2 | Temperature2 |
I am trying to make a bubble chart which would show the values of Temperature1 and Temperature2 separately on Y-axis. Bubble's color will represent Engine and bubbles wil animate in Y direction with the change in value of Temperatures with change in Year. So Year is the dimension that controls the animation and value of Temperatures are the ones which animate showing results for each Engine.
The problem here is that I want to set Position1 and Position2 as X-axis parameters? I want it like the picture attached here, so that behavior of both Temperatures can be visualized combined in one chart, but separated by a distance on X-axis.
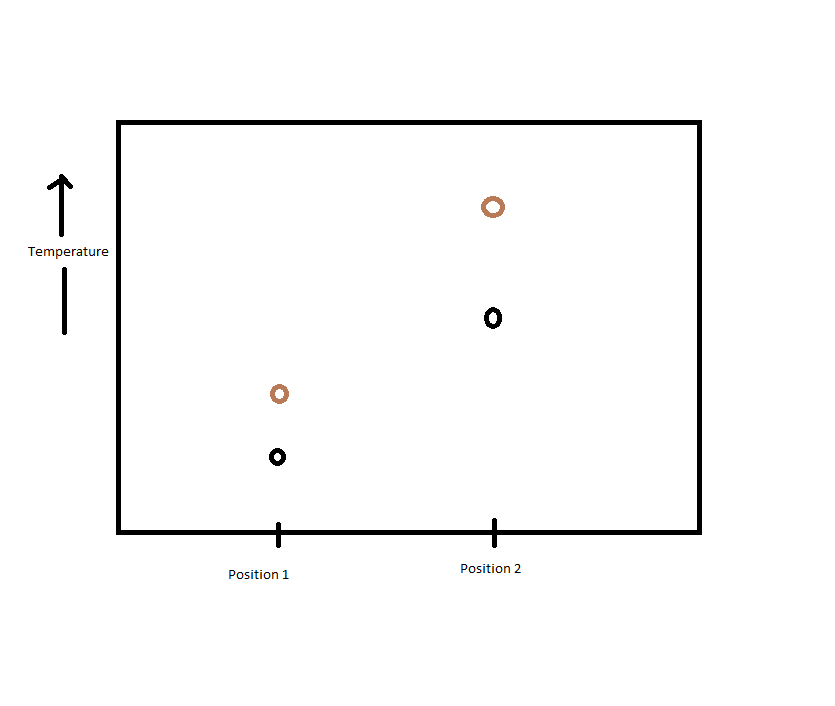
At position1, values of Temperature1 should be shown on Y-axis for different Engines. Similarly, for Position2, values of Temperature2 should be seen.
Please help... Thanks in advance...!!!!