Unlock a world of possibilities! Login now and discover the exclusive benefits awaiting you.
- Qlik Community
- :
- All Forums
- :
- QlikView App Dev
- :
- Re: Combining Alternate and Inherited States
- Subscribe to RSS Feed
- Mark Topic as New
- Mark Topic as Read
- Float this Topic for Current User
- Bookmark
- Subscribe
- Mute
- Printer Friendly Page
- Mark as New
- Bookmark
- Subscribe
- Mute
- Subscribe to RSS Feed
- Permalink
- Report Inappropriate Content
Combining Alternate and Inherited States
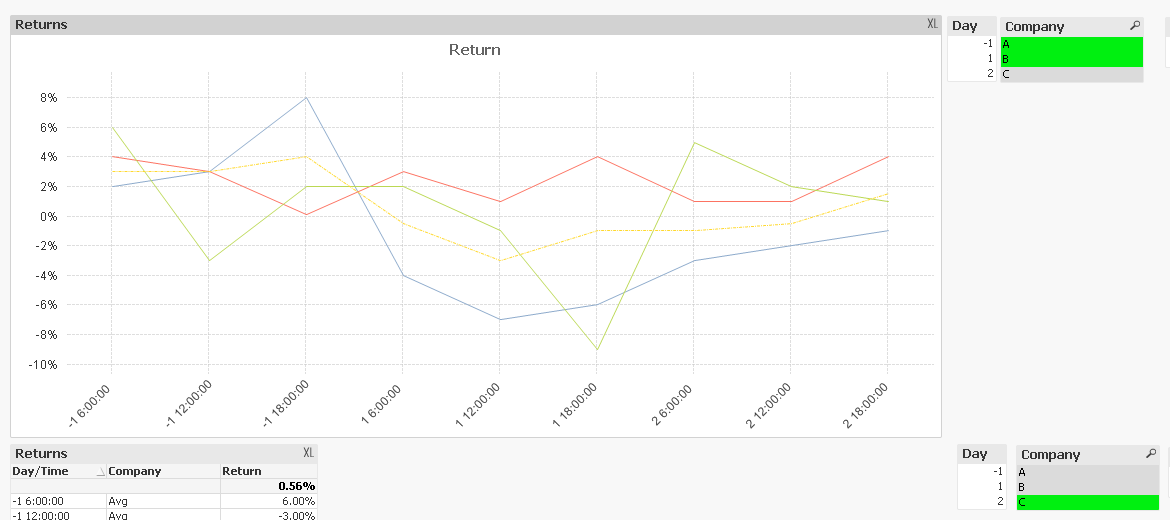
Is it possible to create a line chart that combines the average line from my inherited state, with an expression from an alternate state? Specifically, in the attached, I want to have the top inherited chart show what it currently shows, the bottom chart to show what it currently shows, but I want to add the ability to combine Company C's % Returns to this bottom chart, without affecting the average line of the bottom chart, or the top chart.
- « Previous Replies
-
- 1
- 2
- Next Replies »
Accepted Solutions
- Mark as New
- Bookmark
- Subscribe
- Mute
- Subscribe to RSS Feed
- Permalink
- Report Inappropriate Content
I don't see how this can be improved using Alternate State. There might be a way to do this using variable. May be look into the attached and see if this is any faster
- Mark as New
- Bookmark
- Subscribe
- Mute
- Subscribe to RSS Feed
- Permalink
- Report Inappropriate Content
Check this:
If(Only({$+AltState1}DIM)=1,
Only({$+AltState1}aggr(sum({$+AltState1}PercentRet_atInterval),ID,RelativeDayBuild,TimeofDayBuild)),
avg(TOTAL<RelativeDayAndTime> aggr(sum(PercentRet_atInterval),ID,RelativeDayBuild,TimeofDayBuild))
)
- Mark as New
- Bookmark
- Subscribe
- Mute
- Subscribe to RSS Feed
- Permalink
- Report Inappropriate Content
Hey Sunny - I'm afraid my actual data model is very large and this seems to be causing a severe drag on speed. Is there another way around this?
- Mark as New
- Bookmark
- Subscribe
- Mute
- Subscribe to RSS Feed
- Permalink
- Report Inappropriate Content
Is the requirement that you want to see a line for all Company, but the average for the selected ones?
- Mark as New
- Bookmark
- Subscribe
- Mute
- Subscribe to RSS Feed
- Permalink
- Report Inappropriate Content
Going back to my original file, I need two lines in the bottom chart. I need a line chart with the dynamic average line of companies that are selected in the top chart (so the average line is the same in both charts regardless of filter). But then I also need the ability in the bottom chart to be able to include the line of actual returns for any specific company chosen in the Alt State (could be A, B, or C). So when I filter again in the inherited state, it will affect the companies plotted in the top chart, and the average line in both charts, but not the specific Company in the bottom chart that I selected in the Alt State list box.
- Mark as New
- Bookmark
- Subscribe
- Mute
- Subscribe to RSS Feed
- Permalink
- Report Inappropriate Content
Can you check now
Note: Avg of A and B seems to exactly match with C's number, so make sure to choose another company in AltState1 when you have A and B selected in inherited state.
- Mark as New
- Bookmark
- Subscribe
- Mute
- Subscribe to RSS Feed
- Permalink
- Report Inappropriate Content
Yes this is very close. However, when I filter for A and B in the top chart, and only for Company C in the bottom chart, I need to have two lines in the bottom chart. The Average line (from Companies A and B), and the return line of Company C. Is this do-able?
- Mark as New
- Bookmark
- Subscribe
- Mute
- Subscribe to RSS Feed
- Permalink
- Report Inappropriate Content
Sorry, just saw your note. I don't think this is the case..The average for "-1 6:00:00" is .03, while Company C is .06, and for "-1 12:00:00" is .03, while Company C is -.03?
- Mark as New
- Bookmark
- Subscribe
- Mute
- Subscribe to RSS Feed
- Permalink
- Report Inappropriate Content
See if it is working and giving you right solution
If(Only({AltState1+$}DIM) = 1,
Only({AltState1} Aggr(Sum({AltState1}PercentRet_atInterval),ID,RelativeDayBuild,TimeofDayBuild)),
avg({$}TOTAL<RelativeDayAndTime> aggr(sum({$}PercentRet_atInterval),ID,RelativeDayBuild,TimeofDayBuild))
)
- Mark as New
- Bookmark
- Subscribe
- Mute
- Subscribe to RSS Feed
- Permalink
- Report Inappropriate Content
Yes thank you, it works great. However, it's severely slowed down the application as my data model is very large (millions of rows). Is there a way to do this without compromising the drag on speed?
- « Previous Replies
-
- 1
- 2
- Next Replies »