Unlock a world of possibilities! Login now and discover the exclusive benefits awaiting you.
- Qlik Community
- :
- All Forums
- :
- QlikView App Dev
- :
- Combining Year/Month Fields
- Subscribe to RSS Feed
- Mark Topic as New
- Mark Topic as Read
- Float this Topic for Current User
- Bookmark
- Subscribe
- Mute
- Printer Friendly Page
- Mark as New
- Bookmark
- Subscribe
- Mute
- Subscribe to RSS Feed
- Permalink
- Report Inappropriate Content
Combining Year/Month Fields
I have a date field that we want to use the month and year parts of to get a summary of data for those dates. This has what been put in the script...
Date([Doc. Date],'YYYY-MM') as DOCDATE,
The table is fine when a year is selected, but when the user selects a specific month, I would want the data to be summed into one column than split like this
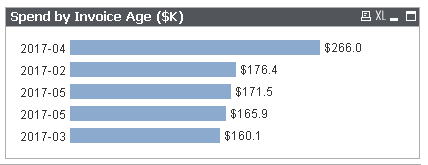
As you can see, we have 2 different columns for 2017-05 and I would only expect to see 1.
Can we do this?
Accepted Solutions
- Mark as New
- Bookmark
- Subscribe
- Mute
- Subscribe to RSS Feed
- Permalink
- Report Inappropriate Content
Hi
Try this
Monthname(Monthstart([Doc.Date])) As DocDate
Regards
Mahesh.
- Mark as New
- Bookmark
- Subscribe
- Mute
- Subscribe to RSS Feed
- Permalink
- Report Inappropriate Content
You have two different dates behind Doc.Date, the formatting shows them only as if it is the same.
Try to use
DATE(MONTHSTART([Doc.Date], 'YYYY-MM') AS DOCDATE
Thus all dates will have the same value and will be displayed in the required format.
Peter
- Mark as New
- Bookmark
- Subscribe
- Mute
- Subscribe to RSS Feed
- Permalink
- Report Inappropriate Content
The table is now saying there is no data to display
- Mark as New
- Bookmark
- Subscribe
- Mute
- Subscribe to RSS Feed
- Permalink
- Report Inappropriate Content
Hi
Try this
Monthname(Monthstart([Doc.Date])) As DocDate
Regards
Mahesh.
- Mark as New
- Bookmark
- Subscribe
- Mute
- Subscribe to RSS Feed
- Permalink
- Report Inappropriate Content
yes, a ")" was missing
- Mark as New
- Bookmark
- Subscribe
- Mute
- Subscribe to RSS Feed
- Permalink
- Report Inappropriate Content
Hi Kathryn,
Why can't we model the data in such a way that you have Month and Year as two different dimensions (by using SubField function) along with existing Doc date in the same table so, during the selection you can simply use a List box for Month and another list box for Year and select based on which you can see the bar chart. I'm not sure if the simplification helps you meet the requirement.
Best regards,
Ambareesh J
- Mark as New
- Bookmark
- Subscribe
- Mute
- Subscribe to RSS Feed
- Permalink
- Report Inappropriate Content
Hi Ambareesh,
We also had a master calendar connected to a different date within this data set, this one needed to be seperate
Kathryn