Unlock a world of possibilities! Login now and discover the exclusive benefits awaiting you.
- Qlik Community
- :
- All Forums
- :
- QlikView App Dev
- :
- Re: Combo Chart - 2 Dimension 2 Expressions
- Subscribe to RSS Feed
- Mark Topic as New
- Mark Topic as Read
- Float this Topic for Current User
- Bookmark
- Subscribe
- Mute
- Printer Friendly Page
- Mark as New
- Bookmark
- Subscribe
- Mute
- Subscribe to RSS Feed
- Permalink
- Report Inappropriate Content
Combo Chart - 2 Dimension 2 Expressions
Hi all.
I am trying to make a combo chart with 2 dimensions and 2 expressions.
I am facing a issue here and I can not achieve a solution. What I need is a chart as the image above.
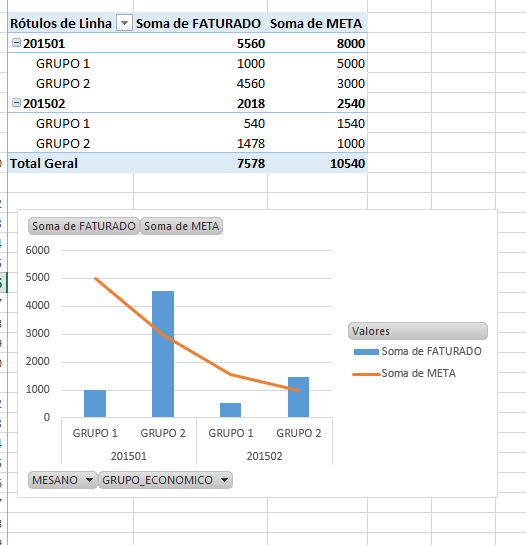
But I can't do it in Qlikview . I was trying to overlap two graphs but neither with a line chart I can achieve what I need.
Thank you for the help.
Accepted Solutions
- Mark as New
- Bookmark
- Subscribe
- Mute
- Subscribe to RSS Feed
- Permalink
- Report Inappropriate Content
- Mark as New
- Bookmark
- Subscribe
- Mute
- Subscribe to RSS Feed
- Permalink
- Report Inappropriate Content
he is the right person to give the solution to u 
- Mark as New
- Bookmark
- Subscribe
- Mute
- Subscribe to RSS Feed
- Permalink
- Report Inappropriate Content
You can create a Cyclic group with the the 2 dimensions "GRUPO_ECONOMICO" and "MESANO" and for expressions use Sum(FATURADO) and Sum(META) using the second expression as a line. (See attached)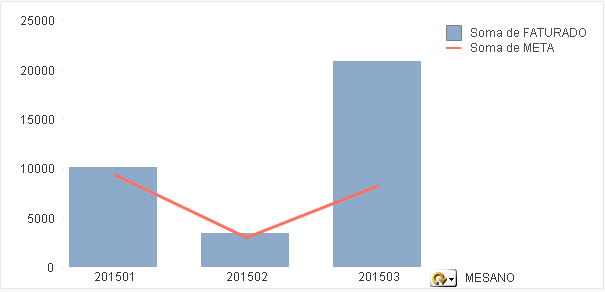 ! !
! !
- Mark as New
- Bookmark
- Subscribe
- Mute
- Subscribe to RSS Feed
- Permalink
- Report Inappropriate Content
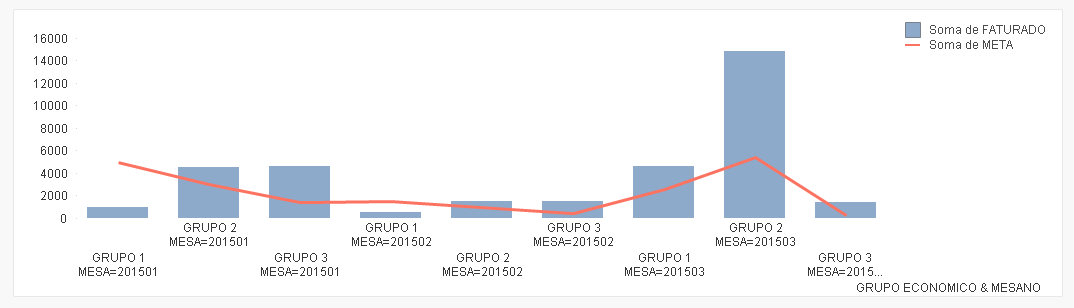
Or if you need to have them in the same view, create a calculated dimension:
=GRUPO_ECONOMICO & CHR (10) & 'MESA=' & MESANO
- Mark as New
- Bookmark
- Subscribe
- Mute
- Subscribe to RSS Feed
- Permalink
- Report Inappropriate Content
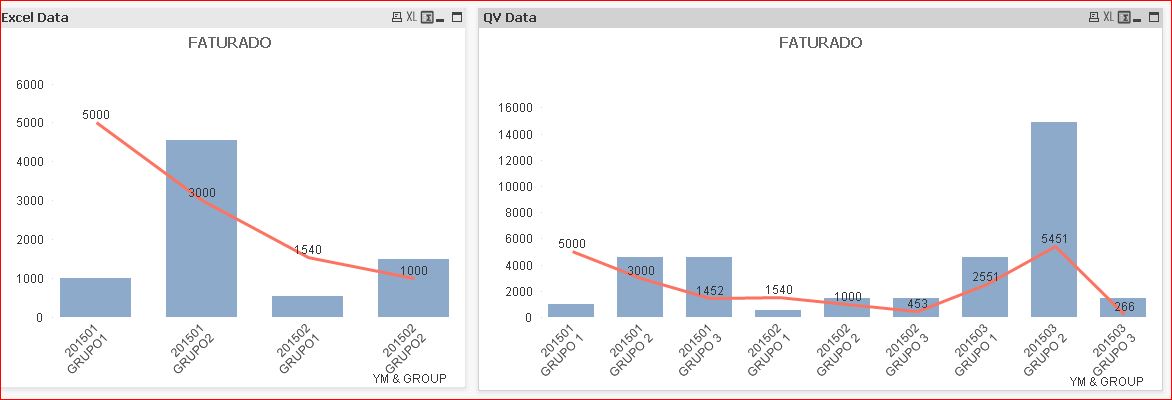
Everybody is a right person 🙂
May be like this?

- Mark as New
- Bookmark
- Subscribe
- Mute
- Subscribe to RSS Feed
- Permalink
- Report Inappropriate Content
From my point of view Ur r champ in this type of issues.
- Mark as New
- Bookmark
- Subscribe
- Mute
- Subscribe to RSS Feed
- Permalink
- Report Inappropriate Content
That's exactly what I was looking for. I needed a drilldown in the second dimension but I solved the problem with a conditional clause.
Thank you !!! 
- Mark as New
- Bookmark
- Subscribe
- Mute
- Subscribe to RSS Feed
- Permalink
- Report Inappropriate Content
That's what I needed.
Thank you very much!