Unlock a world of possibilities! Login now and discover the exclusive benefits awaiting you.
- Qlik Community
- :
- All Forums
- :
- QlikView App Dev
- :
- Combo chart help
- Subscribe to RSS Feed
- Mark Topic as New
- Mark Topic as Read
- Float this Topic for Current User
- Bookmark
- Subscribe
- Mute
- Printer Friendly Page
- Mark as New
- Bookmark
- Subscribe
- Mute
- Subscribe to RSS Feed
- Permalink
- Report Inappropriate Content
Combo chart help
Hello,
Newer to Qlikview and I am looking for some help creating a combo chart. I have been able to set up the line portion of the chart, which is a sum of sales per period. Period is set up in the form 201301, 201302, etc, and covers 2 years. I am having trouble setting up the bar graph part of the chart, where I am trying to show the change between months, while also trying to take care of change between 201401 and 201312.
Here are my fields -
Sales
Period
States
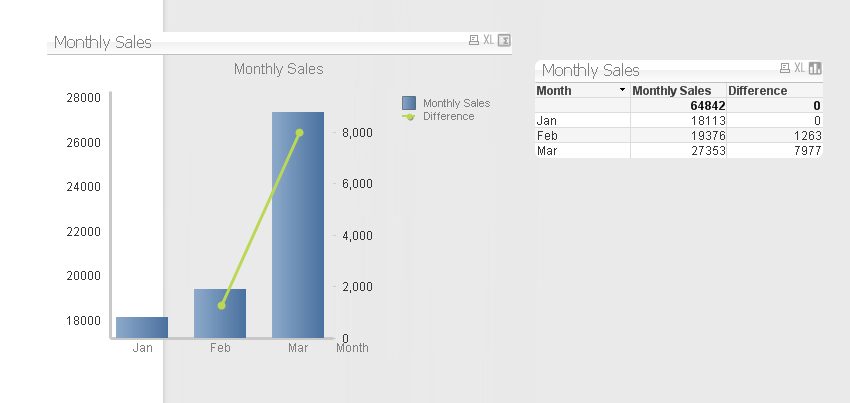
Bar Graph should look like:
Sales 201302-201301, Sales 201303-201302, and etc
Thank you,
Justin
- « Previous Replies
-
- 1
- 2
- Next Replies »
Accepted Solutions
- Mark as New
- Bookmark
- Subscribe
- Mute
- Subscribe to RSS Feed
- Permalink
- Report Inappropriate Content
hmm... i think i overcomplicated it
switch it to :
sum(Sales)- above( sum(Sales))
for the first row, there is no difference so add a check to 0 out the first value for difference
sum(Sales)- if( isnull(above( sum(Sales))), sum(Sales),above(sum(Sales)))
If you need a breakdown by State, we can do that too, its a very similar check to ensure the State on the above row is the same as the current row
- Mark as New
- Bookmark
- Subscribe
- Mute
- Subscribe to RSS Feed
- Permalink
- Report Inappropriate Content
If i understandy you correctly , your lines use an expression similar to this: sum(Sales)
If that is the case, try using the following expression for your bars: sum(Sales) - Above( sum(Sales),0,1)
the above() function grabs previous dimension values . In this case 0 is the offset and 1 is the number of preceding records to grab. It should give you this month - last month
- Mark as New
- Bookmark
- Subscribe
- Mute
- Subscribe to RSS Feed
- Permalink
- Report Inappropriate Content
Jonathan,
That did not seem to work. In the excel file that I loaded into Qlikview, the data is set up with multiple sales figures by states, in each month. I typed the above as is, and it did not bring in anything. Also, this did not work when I tried it in an input box.
Any other thoughts?
- Mark as New
- Bookmark
- Subscribe
- Mute
- Subscribe to RSS Feed
- Permalink
- Report Inappropriate Content
Ok. Then i will need more information about your app. Can you share your QVW ? screenshot of your line chart so far ?
- Mark as New
- Bookmark
- Subscribe
- Mute
- Subscribe to RSS Feed
- Permalink
- Report Inappropriate Content
Here is a copy of some of my data
| Year | Month | Risk state | Sales |
| 2014 | Jan | AL | 842 |
| 2014 | Jan | AL | 11281 |
| 2014 | Jan | AL | 13717 |
| 2014 | Jan | AL | 0 |
| 2014 | Jan | AL | 612 |
| 2014 | Jan | AL | 11564 |
| 2014 | Jan | AL | 0 |
| 2014 | Jan | AL | 0 |
| 2014 | Jan | AL | 0 |
| 2014 | Jan | AL | 0 |
| 2014 | Jan | AL | 710 |
| 2014 | Jan | AK | 0 |
| 2014 | Jan | AK | 198 |
| 2014 | Jan | AK | 0 |
| 2014 | Jan | AK | 0 |
| 2014 | Jan | AK | 0 |
| 2014 | Jan | AK | 0 |
| 2014 | Jan | AK | 0 |
| 2014 | Jan | AK | 0 |
| 2014 | Jan | AK | 0 |
| 2014 | Jan | AK | 0 |
| 2014 | Jan | AK | 13 |
| 2014 | Jan | AZ | 1016 |
| 2014 | Jan | AZ | 16536 |
| 2014 | Jan | AZ | 15731 |
| 2014 | Jan | AZ | 0 |
| 2014 | Jan | AZ | 829 |
| 2014 | Jan | AZ | 755 |
| 2014 | Jan | AZ | 0 |
| 2014 | Jan | AZ | 0 |
| 2014 | Jan | AZ | 0 |
| 2014 | Jan | AZ | 0 |
| 2014 | Jan | AZ | 1056 |
| 2014 | Jan | AR | 242 |
| 2014 | Jan | AR | 5983 |
| 2014 | Jan | AR | 5471 |
- Mark as New
- Bookmark
- Subscribe
- Mute
- Subscribe to RSS Feed
- Permalink
- Report Inappropriate Content
- Mark as New
- Bookmark
- Subscribe
- Mute
- Subscribe to RSS Feed
- Permalink
- Report Inappropriate Content
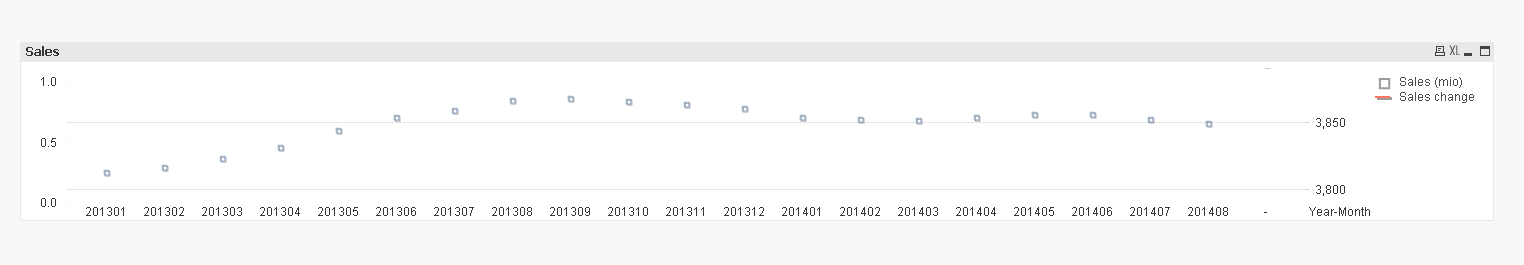
And there is my corresponding graph using the code. It does not seem to be loading in anything to the sales change line.
- Mark as New
- Bookmark
- Subscribe
- Mute
- Subscribe to RSS Feed
- Permalink
- Report Inappropriate Content
hmm... i think i overcomplicated it
switch it to :
sum(Sales)- above( sum(Sales))
for the first row, there is no difference so add a check to 0 out the first value for difference
sum(Sales)- if( isnull(above( sum(Sales))), sum(Sales),above(sum(Sales)))
If you need a breakdown by State, we can do that too, its a very similar check to ensure the State on the above row is the same as the current row
- Mark as New
- Bookmark
- Subscribe
- Mute
- Subscribe to RSS Feed
- Permalink
- Report Inappropriate Content
Jonathan,
Thank you for the help, that worked. Can you explain the syntax so I can understand better for further use.
Thanks again!!
- Mark as New
- Bookmark
- Subscribe
- Mute
- Subscribe to RSS Feed
- Permalink
- Report Inappropriate Content
Great.
The above() function is handy in this because it allows you to grab the value for the previous dimension value. Imagine your chart in tabular/text format. above() is grabbing the value that literally comes before. You can grab the row from 1 row above or multiple rows , even sum up multiple rows. there are other functions like this like before() , previous(), top(), bottom() etc...
Now when you are calculating the FIRST dimension value, there is no value before it and above() returns NULL. In that case i use isnull() to check for that situation and calculate differently.
Does that help ?
- « Previous Replies
-
- 1
- 2
- Next Replies »