Unlock a world of possibilities! Login now and discover the exclusive benefits awaiting you.
- Qlik Community
- :
- All Forums
- :
- QlikView App Dev
- :
- Combo chart values on data points colors?
- Subscribe to RSS Feed
- Mark Topic as New
- Mark Topic as Read
- Float this Topic for Current User
- Bookmark
- Subscribe
- Mute
- Printer Friendly Page
- Mark as New
- Bookmark
- Subscribe
- Mute
- Subscribe to RSS Feed
- Permalink
- Report Inappropriate Content
Combo chart values on data points colors?
Hi All,
I am facing an issue on adjusting data points in combo chat,
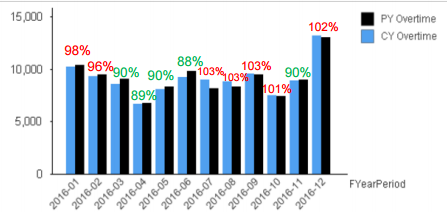
the required output of the chart should be like
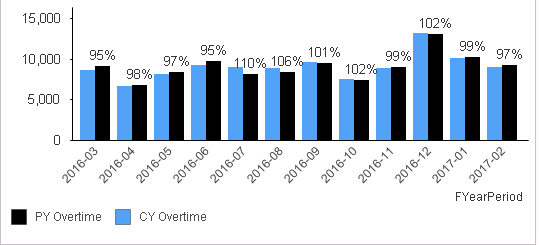
but our chart output is appearing like below shown.
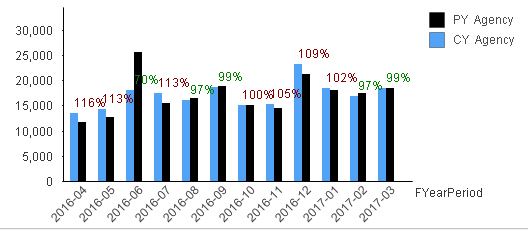
How to move values on data points on top of each combo bar as shown in first pic, for example in third bar(70%) is in incorrect position. For the values on data points i am using third expression and keeping that bar expression as invisible.
Thanks,
Ganesh
- « Previous Replies
-
- 1
- 2
- Next Replies »
- Mark as New
- Bookmark
- Subscribe
- Mute
- Subscribe to RSS Feed
- Permalink
- Report Inappropriate Content
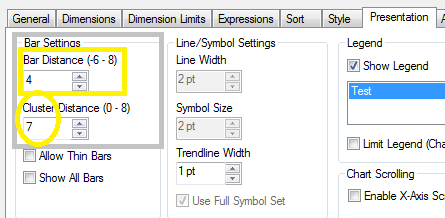
May be try with these, Chart seems simple Bar chart but your title showing Combo Chart. Please confirm that which chart is that
1) To set single bar - Please check Stacked Radio Button

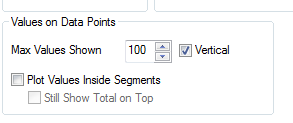
2) To plot and showing good data points, May be check vertical option from Presentation Tab of that object
- Mark as New
- Bookmark
- Subscribe
- Mute
- Subscribe to RSS Feed
- Permalink
- Report Inappropriate Content
Is 'Bar' unchecked also? on the expression's tab?
- Mark as New
- Bookmark
- Subscribe
- Mute
- Subscribe to RSS Feed
- Permalink
- Report Inappropriate Content
Hi Sunny,
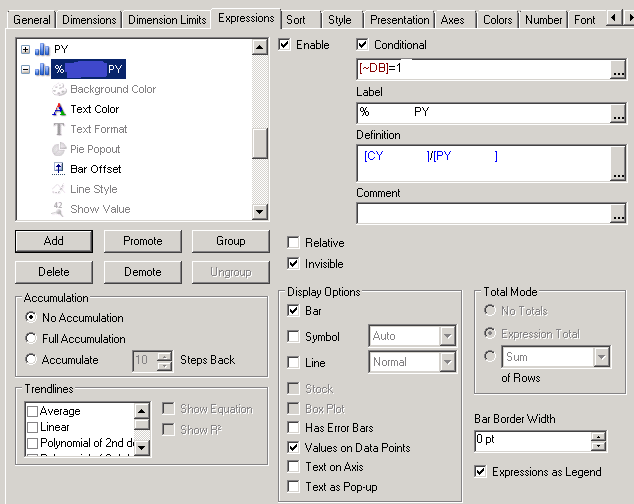
No Bar option is checked, if i un-check the Bar option the color code for values is not appearing.
I have given below shown options for values expression,
- Mark as New
- Bookmark
- Subscribe
- Mute
- Subscribe to RSS Feed
- Permalink
- Report Inappropriate Content
Hi Anil,
It is combo chart only, the same chart is reused for several other KPIs(conditional enabling) so we can not change it to Bar staked/grouped bar chart.
Thanks
- Mark as New
- Bookmark
- Subscribe
- Mute
- Subscribe to RSS Feed
- Permalink
- Report Inappropriate Content
No Bar option is checked, if i un-check the Bar option the color code for values is not appearing.
Color code for values is not appearing? Not sure I understand
- Mark as New
- Bookmark
- Subscribe
- Mute
- Subscribe to RSS Feed
- Permalink
- Report Inappropriate Content
How about this?
Because, I used this when i was with same issue. That time i have 20-25 values with Good Visualization. I just convey and discuss with the client regarding this. So that, They've agree with me finally and i proved my self too.
- Mark as New
- Bookmark
- Subscribe
- Mute
- Subscribe to RSS Feed
- Permalink
- Report Inappropriate Content
Hi Sunny,
Currently bar potion is checked.
if i Un-check the bar option in expression tab colored values for values on data points are not appearing. FYI please find below.
For more info the % values are having separate expression i.e to show values on data points.
Thanks,
- Mark as New
- Bookmark
- Subscribe
- Mute
- Subscribe to RSS Feed
- Permalink
- Report Inappropriate Content
Would you be able to share a sample where you are trying this out? Might be easier for me to play around with a little to see if I can get what you want
- Mark as New
- Bookmark
- Subscribe
- Mute
- Subscribe to RSS Feed
- Permalink
- Report Inappropriate Content
Hi Ganesh,
How did you calculate the % expression value, Can you share the Snapshot of the calculation.
- « Previous Replies
-
- 1
- 2
- Next Replies »