Unlock a world of possibilities! Login now and discover the exclusive benefits awaiting you.
- Qlik Community
- :
- All Forums
- :
- QlikView App Dev
- :
- Compare Same Day Last Year and Calculate Percentag...
- Subscribe to RSS Feed
- Mark Topic as New
- Mark Topic as Read
- Float this Topic for Current User
- Bookmark
- Subscribe
- Mute
- Printer Friendly Page
- Mark as New
- Bookmark
- Subscribe
- Mute
- Subscribe to RSS Feed
- Permalink
- Report Inappropriate Content
Compare Same Day Last Year and Calculate Percentage Growth
Objective: To calculate year over year growth by day. If the user selects April 2018, it would compare each day in April with the same day in the previous year. The same day being the number, not the day of the week.
Dimension: MonthDay
Expression: (2018 Units - 2017 Units) / 2017 Units
=(((SUM(b50_transientunits))
-
(Sum({<b50_Year= {$(=(b50_Year-1))}, b50_Month = {$(=(b50_Month))}, b50_Day = {$(=(b50_Day))} >}b50_transientunits))))
/
(Sum({<b50_Year= {$(=(b50_Year-1))}, b50_Month = {$(=(b50_Month))}, b50_Day = {$(=(b50_Day))} >}b50_transientunits))
When the above is in a Text box, the calculation is correct for a single day selection (2018-04-01, for example). When I put it as the expression in a chart, it yields -1 if only 1 day is selected.
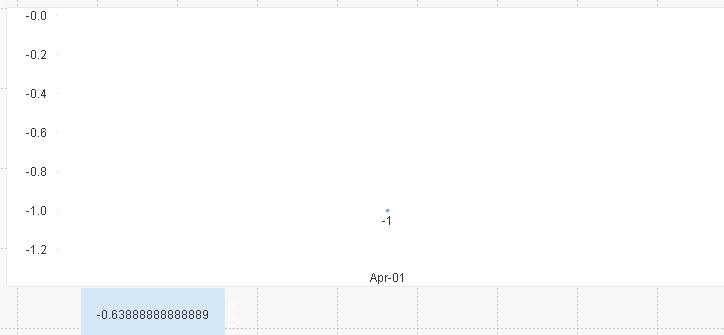
If more days are selected, the chart will display "No data to display"
Example data (date, units):
2018-04-01, 13
2018-04-02, 53
2017-04-01, 36
2017-04-02, 23
The values I expect to see in the chart are:
Apr-01 = -63.89% ((13-36)/36)*100
Apr-02 = 130.43% ((53-23)/23)*100
and so on...
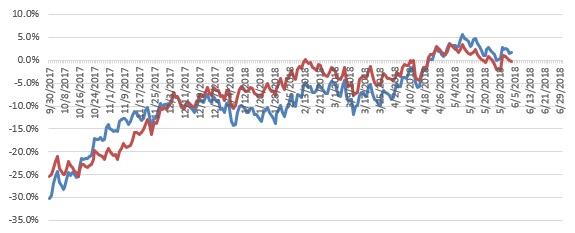
The desired chart should look like this:
Thanks in advance for any assistance.
Accepted Solutions
- Mark as New
- Bookmark
- Subscribe
- Mute
- Subscribe to RSS Feed
- Permalink
- Report Inappropriate Content
Since my data source is SQL, I was able to create a table that has the date for selection and a column for the previous year data needed. Thanks for the reply
- Mark as New
- Bookmark
- Subscribe
- Mute
- Subscribe to RSS Feed
- Permalink
- Report Inappropriate Content
I suggest you to use The As-Of Table for this for best performance.... otherwise you can try using Missing Manual - Above() and Below() also... but it might get tricky because of the number of days in an year can vary....
- Mark as New
- Bookmark
- Subscribe
- Mute
- Subscribe to RSS Feed
- Permalink
- Report Inappropriate Content
Since my data source is SQL, I was able to create a table that has the date for selection and a column for the previous year data needed. Thanks for the reply