Unlock a world of possibilities! Login now and discover the exclusive benefits awaiting you.
- Qlik Community
- :
- All Forums
- :
- QlikView App Dev
- :
- Compare two data sets CurrentModel against Project...
- Subscribe to RSS Feed
- Mark Topic as New
- Mark Topic as Read
- Float this Topic for Current User
- Bookmark
- Subscribe
- Mute
- Printer Friendly Page
- Mark as New
- Bookmark
- Subscribe
- Mute
- Subscribe to RSS Feed
- Permalink
- Report Inappropriate Content
Compare two data sets CurrentModel against ProjectedModel
Hi, I am new to QlikView. i normally work in SQL
I have been tasked to do the following, i am not sure if you can even do this in QlikView.
I have a dataset of 5 linked tables named CurrentModel in SQL.
I want to create two views in QlikView using the same tables one view is called CurrentModel and the other view to be called ProjectedModel
the only difference between the two are CurrentModel will always be this Financial year and ProjectedModel will be next Financial year.
What i have noticed is if i bring both datasets into QlikView with the same field names QlikView joins both datasets on the all the field names.
What i need to do is have both datasets sitting next to each other and a global field that say if i change Expense for ToiletRolls then both models update to show the difference.
Firstly am i doing this right bringing in two datasets, or can i mirror the one dataset and then apply a different date for each. or ????
thanks, i hope i have explained this well enough
- Tags:
- new_to_qlikview
Accepted Solutions
- Mark as New
- Bookmark
- Subscribe
- Mute
- Subscribe to RSS Feed
- Permalink
- Report Inappropriate Content
I think you want to CONCATENATE (Union) the data, not JOIN. So for both sets of data the Inpatients field would be named "Inpatients". Each row would have discriminator field that would identify the type. You could use one discriminator field or two, depending on the expression style.
For example, if the fieldname was "Type" with values 'Current', 'Projected', you would use set analysis
=sum({<[Type={"Current"} [ICU Hours])
If you used two flag fields.
IsCurrent = 0/1
IsProjected = 0/1
then you would use flag multiplication
=sum([ICU Hours] * IsCurrent)
You can mix both techniques.
-Rob
- Mark as New
- Bookmark
- Subscribe
- Mute
- Subscribe to RSS Feed
- Permalink
- Report Inappropriate Content
Hi kiwidave,
not completely sure If I understood but I try:
Is is correct that you have data for this financial year (with kind of time line?), but no data for the next FY in your data source?
Then you want to load that data twice, once with label thisFY, one with label nextFY, and then you want to do what?
It sounds to me that you want to do something like what-if analysis, changing values in nextFY and see what the effect is by looking at the difference of some KPIs to thisFY?
Is this close to what you want to achieve or am I already way off?
Trying to answer your question, it is pretty easy to mirror an already loaded table and apply a different date or label (like changing label thisFY --> nextFY or changing year date value).
In QlikView this would result in one concatenated table, but you can easily separate both views by use of the label or date in all graphs / calculations / reports.
Regards,
Stefan
- Mark as New
- Bookmark
- Subscribe
- Mute
- Subscribe to RSS Feed
- Permalink
- Report Inappropriate Content
Hi swuehi
Thanks for your answer.
Yes this is correct,
Let me continue.
I have a data set on hospitals.
The data is running the cost of running a hospital.
i want to bring this data into QlikView as CurrentFinancial and ProjectedFinancial, so yes same data source but two views of the same data, in SQL i have created two sets of querys, CurrentFinancial has 2010/2011 financial year and ProjectedFinanacial has 2010/2012 financial year. this may or may not be the correct method.
I have bought both datasets in but this is loading two sets of tables, so ineffect i have two databases of the same data in QlikView, Maybe i can load the CurrentFinancial and have (1 data set) a Header Label for the ProjectedFinanacial meaning a new set is created or do i need to bring in the two sets?.
Once i have them side by side on a tab, i want to in a control say - choose a hospital, and both data sets refresh to the hospital i choose, and create controls like this.
Thanks for your input.
- Mark as New
- Bookmark
- Subscribe
- Mute
- Subscribe to RSS Feed
- Permalink
- Report Inappropriate Content
Hi kiwidave,
I think the preferred data model is also depending on how you want work with the data.
For example, if you load in two really separate (with not links between fields) sets of data, a selection in one will not effect the other, though you could use variables to set "global" parameter.
Also, you might need to plan for input fields in your data model (fields you may load from the source, but you can edit the values afterwards).
If only a certain range of fields are likely to be manipulated, I think you can reuse most of the data set for both views, having for example one table with parameters (i.e. possible changes between sets) and a additional field indicating which parameter is to be taken for which set.
e.g.
table parameter:
item, cost, label
tissue, 100, current
tissue, 200, projected
water, 150, current
water, 130, projected
within the application, you could have then almost identical graphs for both views, just selecting certain parameter by label.
Does this sound reasonable?
- Mark as New
- Bookmark
- Subscribe
- Mute
- Subscribe to RSS Feed
- Permalink
- Report Inappropriate Content
It sounds to me like you just need a data type field with 'Current' and 'Projected' as values or a financial year field with '2010/2011' or '2011/2012' as values. I don't understand why you would want separate tables in the data model itself. I'd think separate rows would be plenty. If you wish to have separate tables in on the screen, that's a different matter, and set analysis would be one approach to do so. Typically I'd just add financial year as a dimension, though. I certainly may be misunderstanding your needs.
- Mark as New
- Bookmark
- Subscribe
- Mute
- Subscribe to RSS Feed
- Permalink
- Report Inappropriate Content
 Hi Guys,
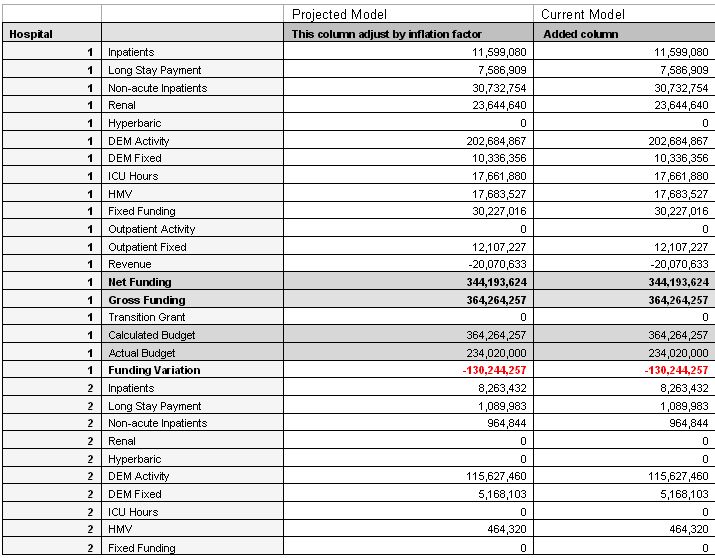
The Directors want to see on screen Current model and Projected model, as seperate Columns would be great.
Senario:
We apply a inflation to the Projected model data changes across the data set, for 2010/2011. Now we want to look at the CurrentModel to compare what we projected . as in the screen shot the CurrentModel would be some how a clone of the Projected model.
Keeping both on the screen together.
The inflation is applied by a variable called the Inflator and can only be applied to the ProjectedModel
To add, i can add a couple of screen shots if this would help?
Thanks for the help.
- Mark as New
- Bookmark
- Subscribe
- Mute
- Subscribe to RSS Feed
- Permalink
- Report Inappropriate Content
So, is the ONLY difference in the data between the current and projected model an inflator? If so, I'd only keep a single copy of the data, and build the chart like this:
dimension 1 = Hospital
dimension 2 = whatever that is
expression "Projected Model" = "Current Model" * (1 + Inflator)
expression "Current Model" = some expression
I'm guessing there's more to it than that, though, requiring you to keep two sets of data. If so, maybe put them all in one table with "Model" as a field and 'Projected' and 'Current' as values. Then make a pivot table:
dimension 1 = Hospital
dimension 2 = whatever that is
dimension 3 = Model // move to the top of the chart
expression = something or other
The above doesn't really have the Inflator at work, though, but I'm not clear if it's as simple as I was showing, and going to two sets of data my assumption was that it isn't. So I'll leave that as is for now.
- Mark as New
- Bookmark
- Subscribe
- Mute
- Subscribe to RSS Feed
- Permalink
- Report Inappropriate Content
Ok,
Let me get this right
by the way thanks for all the help.
Yes i need to keep the two sets of data.
So let me summarise:
I bring in two sets of the same data?
Join them into 1 table with apply different field names to the sets ie. Inpatients for Projected and CpInpatients for Current, or something like this?
Or am i on the wrong path,
Also someone said they bring in 1 set of data, then load the same data with different field names and use the RESIDENT function, can this help me.
- Mark as New
- Bookmark
- Subscribe
- Mute
- Subscribe to RSS Feed
- Permalink
- Report Inappropriate Content
I think you want to CONCATENATE (Union) the data, not JOIN. So for both sets of data the Inpatients field would be named "Inpatients". Each row would have discriminator field that would identify the type. You could use one discriminator field or two, depending on the expression style.
For example, if the fieldname was "Type" with values 'Current', 'Projected', you would use set analysis
=sum({<[Type={"Current"} [ICU Hours])
If you used two flag fields.
IsCurrent = 0/1
IsProjected = 0/1
then you would use flag multiplication
=sum([ICU Hours] * IsCurrent)
You can mix both techniques.
-Rob