Unlock a world of possibilities! Login now and discover the exclusive benefits awaiting you.
- Qlik Community
- :
- All Forums
- :
- QlikView App Dev
- :
- Re: Complex data table - possible
- Subscribe to RSS Feed
- Mark Topic as New
- Mark Topic as Read
- Float this Topic for Current User
- Bookmark
- Subscribe
- Mute
- Printer Friendly Page
- Mark as New
- Bookmark
- Subscribe
- Mute
- Subscribe to RSS Feed
- Permalink
- Report Inappropriate Content
Complex data table - possible
Hi,
I would like to make cumulative data table (Straight table or something) per month. I know this may be to comlex to achieve but if some guru will know I will be forever greatful 
I have monthly data per customers stored, fields: Month, Customer, Sales, WorkCost, PartCost and I would like to display this kind of static table (only customer and month selection will affect data):
201205 201206 201207 201208
Sales 100 120 80 90
WorkCost 30 45 20 25
PartCost 40 60 90 20
OtDirVarCost 2 6 2 9
GrossMargin 10 15 17 20
GM% 20% 25% 24% 20%
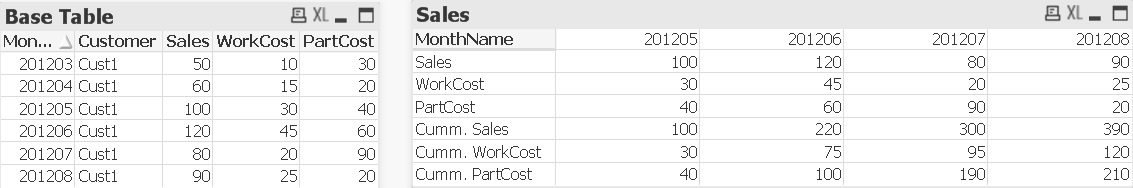
Where months displayed Maximum stored months and 3 months before that. Sales, WorkCosts and PartsCosts should be 4 months cumulative value for example in column 201206 should be seen sales, workcost and partcost summary from months 201203-201206 and in column 201208 from months 201205-201208. OtDirVar should be static percent of the column's sales and grossmargin and GM% will calculated based on other data in the same column.
- Tags:
- new_to_qlikview
Accepted Solutions
- Mark as New
- Bookmark
- Subscribe
- Mute
- Subscribe to RSS Feed
- Permalink
- Report Inappropriate Content
Hi,
I couldn't figure out the problem so I did this cummulative data manually in script. So I will just add summaries for last 4 months as own table in script. I know this isn't the best way to do this but it works.
BR,
Maarit
- Mark as New
- Bookmark
- Subscribe
- Mute
- Subscribe to RSS Feed
- Permalink
- Report Inappropriate Content
Are you looking for something like this?
if you can detail the formula for OtDirVarCost,GrossMargin and GM% it can also be achived.
Attached sample QVW.
- Mark as New
- Bookmark
- Subscribe
- Mute
- Subscribe to RSS Feed
- Permalink
- Report Inappropriate Content
Hi,
almost that but in the table all the figures need to be 4 months cumulative figures from that month which column is back.
In the example below there's first the base table and next the one that I need. I made that one with 2 months cumulative values so that in the column 201208 & Sales it shows sales summary from months 201208 and 201207. Next one shows sales summary from months 201207 and 201206 and so on. Same with costs. OtDirVar is just then percent of the sales of that column and gross margins are calculated based on sales and cost data.
So is this possible?
And for the record I only have personal edition of qlikview at the moment so I can't open the example file you sent.
- Mark as New
- Bookmark
- Subscribe
- Mute
- Subscribe to RSS Feed
- Permalink
- Report Inappropriate Content
You have 2 requirements:
1. Cummulate the sum of measures going back 4 Months
2. Show only the last 4 months
The issue #1 can be achived by sing a RangeSum in your expression:
Ex., =RangeSum(After(Sum(WorkCost),0,4))
[4 - above represents the last 4 values]
Issue #2 can be achived by using Rank Operator in your calcualted dimension:
Ex., = =If(Aggr(Rank(Aggr(Max(MonthName),MonthName),0,1),MonthName)<=4, MonthName, null)
The problem arrises when you want both togther.
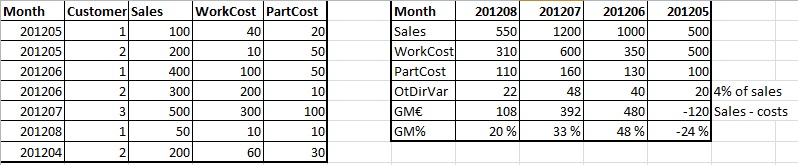
Since you are cutting off 1 month (201204) as per your example above the values for this will not be considered while calculating for 201205.
below example os with 2 month aggregation as per your example: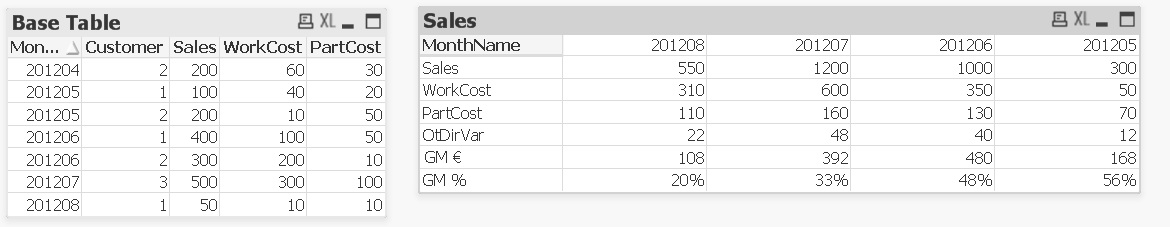
If you remove constraint on the dimension you will get proper values for 201205.
- Mark as New
- Bookmark
- Subscribe
- Mute
- Subscribe to RSS Feed
- Permalink
- Report Inappropriate Content
Hi,
I got the output like that with straight table but for some reason it doesn't display any values. Only 0 for all other fiels than month names and row headers.
I put dimension and expression exactly like you wrote (of course I changed the column names).
What could be the problem?
BR,
Maarit
- Mark as New
- Bookmark
- Subscribe
- Mute
- Subscribe to RSS Feed
- Permalink
- Report Inappropriate Content
Well, unless I see the formula and data you have put I cannot say what the issue is in your dashboard.
Can you upload a sample/dummy file to let u know the issue?
- Mark as New
- Bookmark
- Subscribe
- Mute
- Subscribe to RSS Feed
- Permalink
- Report Inappropriate Content
Hi,
I couldn't figure out the problem so I did this cummulative data manually in script. So I will just add summaries for last 4 months as own table in script. I know this isn't the best way to do this but it works.
BR,
Maarit