Unlock a world of possibilities! Login now and discover the exclusive benefits awaiting you.
- Qlik Community
- :
- All Forums
- :
- QlikView App Dev
- :
- Complex requirement on dynamic expression
- Subscribe to RSS Feed
- Mark Topic as New
- Mark Topic as Read
- Float this Topic for Current User
- Bookmark
- Subscribe
- Mute
- Printer Friendly Page
- Mark as New
- Bookmark
- Subscribe
- Mute
- Subscribe to RSS Feed
- Permalink
- Report Inappropriate Content
Complex requirement on dynamic expression
Hi All,
Hope all of you doing great,
Please help me to to create a chart based on the following criteria.
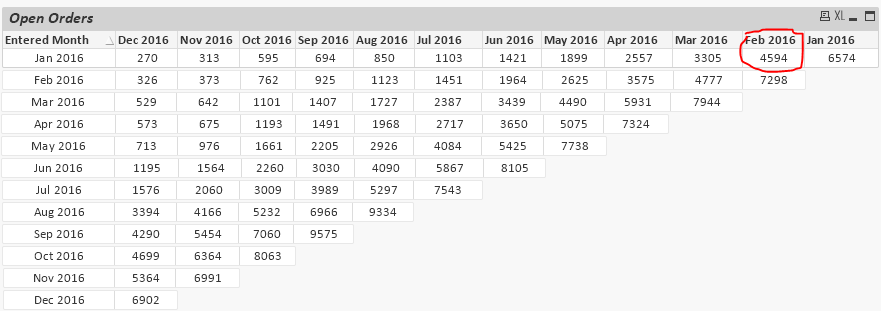
In the open orders tab of attached qvw file i have written static expressions...i need to change those expressions so that it should work dynamically. The main theme of Open orders chart in the attached QVW is:
We need to calculate month wise Open orders data. The required expression should be,
the count of all the distinct orders in a particular month minus count of a cancelled and closed orders in that month.
For Example,
1. to get the Jan 2016 value (As highlighted in red in the below attached Jan 2016.PNG)
count({<ENTERED_Month={'Jan 2016'}>} distinct ID)
-
count({<Status={'CLS'},Closed_Month={'Jan 2016'},ENTERED_Month={'Jan 2016'}>} distinct ID)
-
count({<Status={'CNL'},Cancel_Month={'Jan 2016'},ENTERED_Month={'Jan 2016'}>} distinct ID)
2.to get Feb 2016 value (As highlighted in red in the below attached Feb 2016.PNG)
[Jan 2016] i,e (Value of the above expression)
-
(count({<Status={'CLS'},Closed_Month={'Feb 2016'},ENTERED_Month={'Jan 2016'}>} distinct ID)
+
count({<Status={'CNL'},Cancel_Month={'Feb 2016'},ENTERED_Month={'Jan 2016'}>} distinct ID))
like that same for other month values. Could you please anyone help me on this. Please reach out me if you need any further classifications on this requirement.
Fast responses will be very helpful for me.
- Mark as New
- Bookmark
- Subscribe
- Mute
- Subscribe to RSS Feed
- Permalink
- Report Inappropriate Content
What you mean by dynamic here? Can you tell us?On which field you want to select?
- Mark as New
- Bookmark
- Subscribe
- Mute
- Subscribe to RSS Feed
- Permalink
- Report Inappropriate Content
In the above example, I have given Closed_Month={'Jan 2016'},ENTERED_Month={'Jan 2016'} and some other values static expressions. By giving like this, i am writing N no.of expressions. To reduce this and decreasing the complexity of chart. I am looking the correct method to achieve this.
- Mark as New
- Bookmark
- Subscribe
- Mute
- Subscribe to RSS Feed
- Permalink
- Report Inappropriate Content
Check this, your required answer is on 'sheet3' in the attached qvw with single chart and single expression. Let me know if it is ok.
- Mark as New
- Bookmark
- Subscribe
- Mute
- Subscribe to RSS Feed
- Permalink
- Report Inappropriate Content
Hi Sunil,
Thank you so much for your prompt reply  .
.
Changes looks really good, but when i click on any data point of the chart i am not able to see any value.
If end user clicks on any data point, can we populate all those order details just below the pivot chart?
please help me to achieve this.
- Mark as New
- Bookmark
- Subscribe
- Mute
- Subscribe to RSS Feed
- Permalink
- Report Inappropriate Content
I got confused whose question it was 
Could you please give me an example what you are trying to do?
- Mark as New
- Bookmark
- Subscribe
- Mute
- Subscribe to RSS Feed
- Permalink
- Report Inappropriate Content
Hi Sunil,
Thanks for great help.
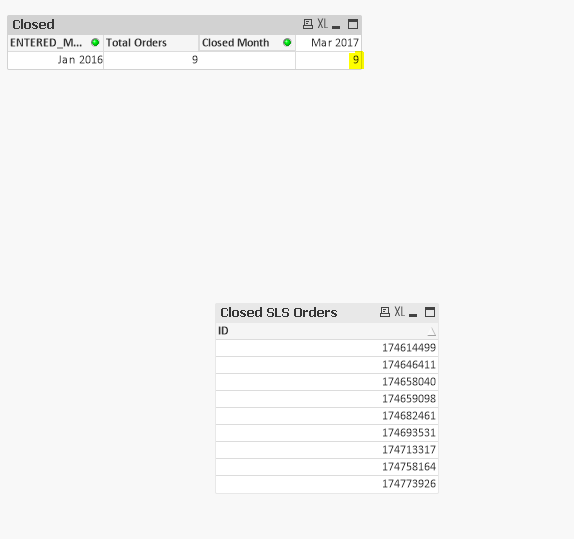
The values in the chart that you developed is close to the requirement. But, the problem here i am facing if some one selects the value in the Data point of that chart we need to display that particular Order ID's in some other chart. I have added the same functionality in the attached Qvw of Cancle orders, Closed orders Tab. The same way, we are looking for the Open orders also. If i select any value in the Closed or Cancled Order chart, the relevant ID's is displaying in the Down of the Chart. I have attached same in the below for your Reference. i.e. Closed.Png
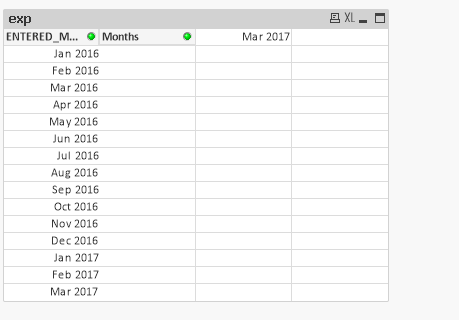
For Open orders, If i select any data point in the chart, The chart showing it self blank. Please observe the same in the below Exp.Png image. Could please help me in this regard to meets the business expectations.
Thanks in Advance...!