Unlock a world of possibilities! Login now and discover the exclusive benefits awaiting you.
- Qlik Community
- :
- All Forums
- :
- QlikView App Dev
- :
- Count Distinct or Count Aggr doesn't return correc...
- Subscribe to RSS Feed
- Mark Topic as New
- Mark Topic as Read
- Float this Topic for Current User
- Bookmark
- Subscribe
- Mute
- Printer Friendly Page
- Mark as New
- Bookmark
- Subscribe
- Mute
- Subscribe to RSS Feed
- Permalink
- Report Inappropriate Content
Count Distinct or Count Aggr doesn't return correct values
Hi all,
I'm having difficulties to use a Count distinct() or Count Aggr()
My table haas duplicate values on column SD_Dest_Pallet.
I want to count the Distinct SD_Dest_Pallet's per Date/Aisle_Facturation/Shop_Ens/
Even the simple sum of SD_Shipped_Colli isn't correct, I'll always get 5 colli to much
In my example (that's attached) I'm using only 1 Aisle_Facturation and 1 Shop_Ens tot test the expressions.
I've a chart with a distinct(Count) and another chart with a Aggr (count)
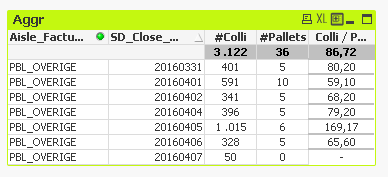
These are the correct values that should be presented in Qlikview:
| SD_Close_Date | Aisle_Facturation | Shop_Ens | #Colli | #Pallet | Colli / Pal Uit |
| 20160331 | PBL_OVERIGE | Pricelist_Hyper | 401 | 5 | 80,20 |
| 20160401 | PBL_OVERIGE | Pricelist_Hyper | 591 | 10 | 59,10 |
| 20160402 | PBL_OVERIGE | Pricelist_Hyper | 341 | 5 | 68,20 |
| 20160404 | PBL_OVERIGE | Pricelist_Hyper | 396 | 5 | 79,20 |
| 20160405 | PBL_OVERIGE | Pricelist_Hyper | 1015 | 6 | 169,17 |
| 20160406 | PBL_OVERIGE | Pricelist_Hyper | 328 | 5 | 65,60 |
| 20160407 | PBL_OVERIGE | Pricelist_Hyper | 50 | 0 | 0,00 |
| TOTAL | 3122 | 36 | 86,72 |
Does anyone see where the problem is situated in my example please???
Monique
- « Previous Replies
-
- 1
- 2
- Next Replies »
Accepted Solutions
- Mark as New
- Bookmark
- Subscribe
- Mute
- Subscribe to RSS Feed
- Permalink
- Report Inappropriate Content
I think you should fix this in your data model.
You can create a flag that indicates the first SD_Close_Date for each pallet, which you then can use to filter in your set expression.
You can create a temporary table with min SD_Close_date and the flag field grouped by an appropriate key (maybe just SD_Dest_pallet), then join this flag back to your facts table.
You can also consider modifying your data model so that you get read of your pallets duplicates, which should simplify your aggregation.
Since we don't know anything about your model or requirement in detail, it's hard to be more specific.
- Mark as New
- Bookmark
- Subscribe
- Mute
- Subscribe to RSS Feed
- Permalink
- Report Inappropriate Content
You aggr solution seems to be working, not sure what the issue is?
- Mark as New
- Bookmark
- Subscribe
- Mute
- Subscribe to RSS Feed
- Permalink
- Report Inappropriate Content
Doesn't the Aggr() chart show exactely these numbers?
- Mark as New
- Bookmark
- Subscribe
- Mute
- Subscribe to RSS Feed
- Permalink
- Report Inappropriate Content
Sorry Guys,
I gave the wrong example, that's a simple chart and there it works fine.
In a complex chart It's another story.
I'll send a correct attach of the complex example showing the wrong values.
- Mark as New
- Bookmark
- Subscribe
- Mute
- Subscribe to RSS Feed
- Permalink
- Report Inappropriate Content
Ya unless we are able to see the issue, it would be difficult to propose a solution
- Mark as New
- Bookmark
- Subscribe
- Mute
- Subscribe to RSS Feed
- Permalink
- Report Inappropriate Content
This is the example with the wrong values.
Both charts show different results and both are wrong results
- Mark as New
- Bookmark
- Subscribe
- Mute
- Subscribe to RSS Feed
- Permalink
- Report Inappropriate Content
If you want to count something per multiple dimensions, you should use these dimensions in the aggr() dimensions as well...
= Count({$ <[SD_WH] -= {12}, [Aisle_Zone] -= {PBS_Containers, PBS_Displays}> }aggr(count([Aisle_Facturation]), SD_Dest_Pallet))
Add your charts dimensions to the aggr() dimension list.
And probably you need to use Sum() as your outer aggregation.
- Mark as New
- Bookmark
- Subscribe
- Mute
- Subscribe to RSS Feed
- Permalink
- Report Inappropriate Content
What is the correct output you are hoping to see?
- Mark as New
- Bookmark
- Subscribe
- Mute
- Subscribe to RSS Feed
- Permalink
- Report Inappropriate Content
Yes, would be helpful to know the expected ouput.
Maybe this?
= Sum({$ <[SD_WH] -= {12}, [Aisle_Zone] -= {PBS_Containers, PBS_Displays}> }
aggr(
count({$ <[SD_WH] -= {12}, [Aisle_Zone] -= {PBS_Containers, PBS_Displays}> }[Aisle_Facturation])
, [$(=GetCurrentField( Aisle ))] ,[$(=GetCurrentField( Enseigne ))], [$(=GetCurrentField( Periods ))]
))
1) Sum as outer aggregation
2) set expression used in both aggregations (not sure if you need to modify
3) full list of dimensions to group by.
Do you also need a count distinct here?
Not sure, missing the expected result or full description of logic.
- Mark as New
- Bookmark
- Subscribe
- Mute
- Subscribe to RSS Feed
- Permalink
- Report Inappropriate Content
The Output that I showed in my initial question:
| SD_Close_Date | Aisle_Facturation | Shop_Ens | #Colli | #Pallet | Colli / Pal Uit |
| 20160331 | PBL_Overige | Pricelist_Hyper | 401 | 5 | 80,20 |
| 20160401 | PBL_Overige | Pricelist_Hyper | 591 | 10 | 59,10 |
| 20160402 | PBL_Overige | Pricelist_Hyper | 341 | 5 | 68,20 |
| 20160404 | PBL_Overige | Pricelist_Hyper | 396 | 5 | 79,20 |
| 20160405 | PBL_Overige | Pricelist_Hyper | 1015 | 6 | 169,17 |
| 20160406 | PBL_Overige | Pricelist_Hyper | 328 | 5 | 65,60 |
| 20160407 | PBL_Overige | Pricelist_Hyper | 50 | 0 | 0,00 |
- « Previous Replies
-
- 1
- 2
- Next Replies »