Unlock a world of possibilities! Login now and discover the exclusive benefits awaiting you.
- Qlik Community
- :
- All Forums
- :
- QlikView App Dev
- :
- Count if the result of count is less than a number
- Subscribe to RSS Feed
- Mark Topic as New
- Mark Topic as Read
- Float this Topic for Current User
- Bookmark
- Subscribe
- Mute
- Printer Friendly Page
- Mark as New
- Bookmark
- Subscribe
- Mute
- Subscribe to RSS Feed
- Permalink
- Report Inappropriate Content
Count if the result of count is less than a number
myData:
LOAD * INLINE [Country, Locaton, Test
C1,L1,T1
C1,L1,T2
C1,L2,T3
C1,L2,T4
C1,L3,T5
C1,L3,T6
C1,L3,T7
C2,L4,T8
C2,L4,T9
C3,L5,T10
C3,L5,T11
C3,L5,T12
];
The test ids are unique
A location might have multiple test
A country might have multiple locations
I need to count by country number of test
where count of tests per location is less than 3
for the above data my result should look like this:
| Country | Count |
|---|---|
| C1 | 4 |
| C2 | 2 |
| C3 | 0 |
thank you all
Accepted Solutions
- Mark as New
- Bookmark
- Subscribe
- Mute
- Subscribe to RSS Feed
- Permalink
- Report Inappropriate Content
Hi Boghos, Sunny, Anil,
I'll be the joker in the pack and suggest
sum(aggr(if(count(Test)<3,count(Test)),Locaton))
This has one thing in it's favour - it will return a zero value in a straight table if suppress zero values is unchecked.
| Country | sum(aggr(if(count(Test)<3,count(Test)),Locaton)) |
|---|---|
| C1 | 4 |
| C2 | 2 |
| C3 | 0 |
vs.
| Country | count({<Locaton ={"=count(Test)<3"}>}Test) |
|---|---|
| C1 | 4 |
| C2 | 2 |
If it's not important to show the zero value then the suggestions of Anil and Sunny are better than this.
cheers
Andrew
- Mark as New
- Bookmark
- Subscribe
- Mute
- Subscribe to RSS Feed
- Permalink
- Report Inappropriate Content
May be this?
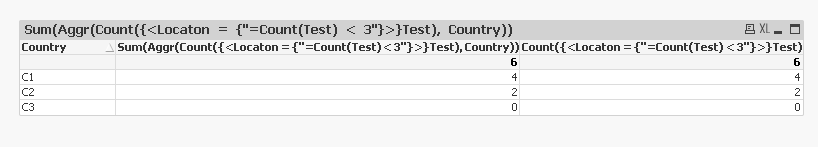
Sum(Aggr(Count({<Locaton = {"=Count(Test) < 3"}>}Test), Country))
Please suppress when value is null from presentation tab
- Mark as New
- Bookmark
- Subscribe
- Mute
- Subscribe to RSS Feed
- Permalink
- Report Inappropriate Content
I think Anil, this should be enough
Count({<Locaton = {"=Count(Test) < 3"}>}Test)
Assuming a location cannot be shared by two countries... for example L1 location is in country C1 and C2
- Mark as New
- Bookmark
- Subscribe
- Mute
- Subscribe to RSS Feed
- Permalink
- Report Inappropriate Content
I though too, But i am grouping because they may have multiple location for each countries.
- Mark as New
- Bookmark
- Subscribe
- Mute
- Subscribe to RSS Feed
- Permalink
- Report Inappropriate Content
AFAIK the two expression should always give the same result
- Mark as New
- Bookmark
- Subscribe
- Mute
- Subscribe to RSS Feed
- Permalink
- Report Inappropriate Content
Haha, Yes. That is where i did. Thanks again
- Mark as New
- Bookmark
- Subscribe
- Mute
- Subscribe to RSS Feed
- Permalink
- Report Inappropriate Content
Hi Boghos, Sunny, Anil,
I'll be the joker in the pack and suggest
sum(aggr(if(count(Test)<3,count(Test)),Locaton))
This has one thing in it's favour - it will return a zero value in a straight table if suppress zero values is unchecked.
| Country | sum(aggr(if(count(Test)<3,count(Test)),Locaton)) |
|---|---|
| C1 | 4 |
| C2 | 2 |
| C3 | 0 |
vs.
| Country | count({<Locaton ={"=count(Test)<3"}>}Test) |
|---|---|
| C1 | 4 |
| C2 | 2 |
If it's not important to show the zero value then the suggestions of Anil and Sunny are better than this.
cheers
Andrew
- Mark as New
- Bookmark
- Subscribe
- Mute
- Subscribe to RSS Feed
- Permalink
- Report Inappropriate Content
Sunny,
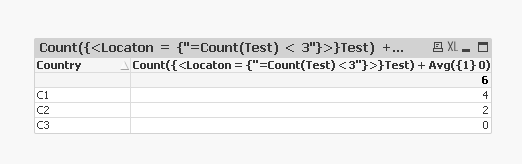
Expression without Aggr() doesn't show C3 = 0.
- Mark as New
- Bookmark
- Subscribe
- Mute
- Subscribe to RSS Feed
- Permalink
- Report Inappropriate Content
Got it, I didn't see because I had two expression... might be easy to use this
Count({<Locaton = {"=Count(Test) < 3"}>}Test) + Avg({1} 0)
instead of Aggr()
- Mark as New
- Bookmark
- Subscribe
- Mute
- Subscribe to RSS Feed
- Permalink
- Report Inappropriate Content
with little scripting you can make the expression more simpler and easy to use with other set modifiers
myData:
LOAD * INLINE [Country, Locaton, Test
C1,L1,T1
C1,L1,T2
C1,L2,T3
C1,L2,T4
C1,L3,T5
C1,L3,T6
C1,L3,T7
C2,L4,T8
C2,L4,T9
C3,L5,T10
C3,L5,T11
C3,L5,T12
];
Left Join(myData)
LOAD Locaton,
Count(Test) as CountTest
Resident myData
Group by Locaton;
Now use below expression
=Count({<CountTest={'<3'}>}Test)
Note:
Uncheck suppress zero option in chart if you want to show zero value