Unlock a world of possibilities! Login now and discover the exclusive benefits awaiting you.
- Qlik Community
- :
- All Forums
- :
- QlikView App Dev
- :
- Count of Maximums
- Subscribe to RSS Feed
- Mark Topic as New
- Mark Topic as Read
- Float this Topic for Current User
- Bookmark
- Subscribe
- Mute
- Printer Friendly Page
- Mark as New
- Bookmark
- Subscribe
- Mute
- Subscribe to RSS Feed
- Permalink
- Report Inappropriate Content
Count of Maximums
Hello experts and fellow students,
I have a problem that I hope you can help me with.
What I need to achieve is to create a Count(_) of the maximums from a data set.
Something like this:
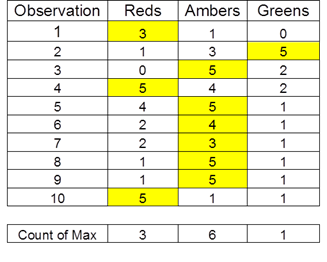
I admit this is stumping me - any insights?
Oh, and the ‘best result’ would be to pre-aggregate this in script as I’m dealing with several million observations - though this isn’t critical.
Qvw below.
- Jeff.
Accepted Solutions
- Mark as New
- Bookmark
- Subscribe
- Mute
- Subscribe to RSS Feed
- Permalink
- Report Inappropriate Content
I see aggregating in script as a solution of last resort. That and several million sounds like a small dataset to me.  You could run those expressions in a chart, but if performance really is an issue, how about flagging the rows themselves, then using set analysis? That way there's no aggregation, but the heavy lifting is still done in script.
if(Reds=rangemax(Reds,Ambers,Greens),1) as RedMaxFlag,
And in the chart:
count({<RedMaxFlag={1}>} Observation)
Same for Ambers and Greens of course. I'm using a 1/null flag because long ago testing showed that to be faster to use than a two-value flag. No idea if that's still the case, though.
edit: We've both assumed that when more than one is the max, we count both. I don't know if that's intended or not, but if not, you'd need some sort of tiebreaker.
- Mark as New
- Bookmark
- Subscribe
- Mute
- Subscribe to RSS Feed
- Permalink
- Report Inappropriate Content
Is this what you are hoping to get?
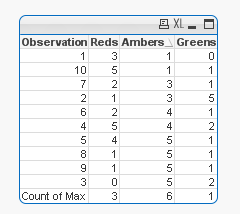
Script:
Table:
LOAD * Inline [
Observation, Reds, Ambers, Greens,
1, 3, 1, 0
2, 1, 3, 5
3, 0, 5, 2
4, 5, 4, 2
5, 4, 5, 1
6, 2, 4, 1
7, 2, 3, 1
8, 1, 5, 1
9, 1, 5, 1
10, 5, 1, 1
];
Concatenate (Table)
LOAD 'Count of Max' as Observation,
Sum(If(RangeMax(Reds, Ambers, Greens) = Reds, 1)) as Reds,
Sum(If(RangeMax(Reds, Ambers, Greens) = Ambers, 1)) as Ambers,
Sum(If(RangeMax(Reds, Ambers, Greens) = Greens, 1)) as Greens
Resident Table;
- Mark as New
- Bookmark
- Subscribe
- Mute
- Subscribe to RSS Feed
- Permalink
- Report Inappropriate Content
I see aggregating in script as a solution of last resort. That and several million sounds like a small dataset to me. You could run those expressions in a chart, but if performance really is an issue, how about flagging the rows themselves, then using set analysis? That way there's no aggregation, but the heavy lifting is still done in script.
if(Reds=rangemax(Reds,Ambers,Greens),1) as RedMaxFlag,
And in the chart:
count({<RedMaxFlag={1}>} Observation)
Same for Ambers and Greens of course. I'm using a 1/null flag because long ago testing showed that to be faster to use than a two-value flag. No idea if that's still the case, though.
edit: We've both assumed that when more than one is the max, we count both. I don't know if that's intended or not, but if not, you'd need some sort of tiebreaker.
- Mark as New
- Bookmark
- Subscribe
- Mute
- Subscribe to RSS Feed
- Permalink
- Report Inappropriate Content
Thank John - Both your solutions and Sunny T's worked, although yours best fit the requirement
- Mark as New
- Bookmark
- Subscribe
- Mute
- Subscribe to RSS Feed
- Permalink
- Report Inappropriate Content
If you got the solution, please mark the answer correct and close the thread.
- Mark as New
- Bookmark
- Subscribe
- Mute
- Subscribe to RSS Feed
- Permalink
- Report Inappropriate Content
Hi Sunny - Really like your solution and helps me with additional understanding.
Thanks for the swift Reply.
- Jeff