Unlock a world of possibilities! Login now and discover the exclusive benefits awaiting you.
- Qlik Community
- :
- All Forums
- :
- QlikView App Dev
- :
- Count out of limits in a range of dates, control c...
- Subscribe to RSS Feed
- Mark Topic as New
- Mark Topic as Read
- Float this Topic for Current User
- Bookmark
- Subscribe
- Mute
- Printer Friendly Page
- Mark as New
- Bookmark
- Subscribe
- Mute
- Subscribe to RSS Feed
- Permalink
- Report Inappropriate Content
Count out of limits in a range of dates, control chart
Dear All,
I need to display count the data that arer out of the limits in the selected time period, i have this:
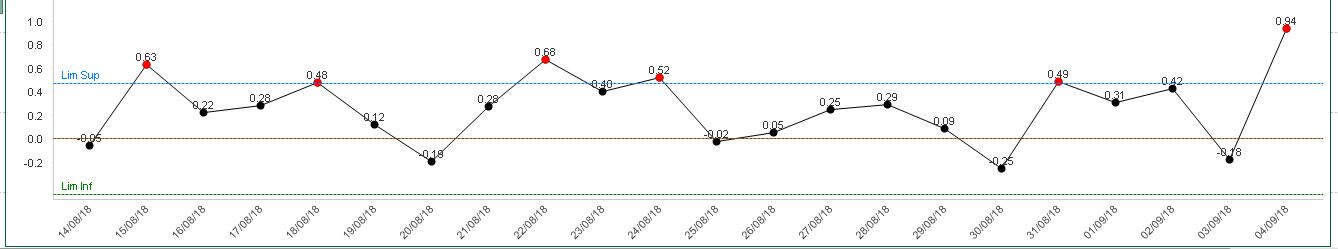
control chart
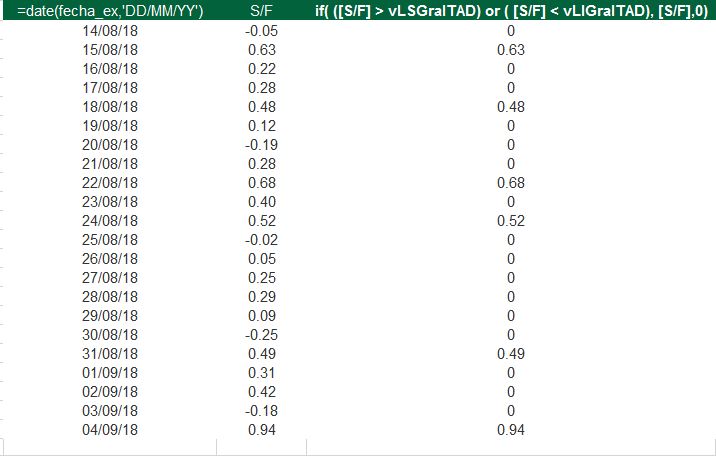
table
i have the expression to know wich ones are out of range:
if( ([S/F] > vLSGralTAD) or ( [S/F] < vLIGralTAD), [S/F],0)
Where i expect how many data are out, in and calculate de percentage of those who are inside de bounds.
Out: 6
In: 16
Total: 22
% In: 72.7 %
Any one can help me to this set expression syntax.
Following is the expression I'm using for count the data where it is not showing any error in expression view but no data returned.
For count the data that are in the limits:
Count( {<if( [S/F] > vLSGralTAD or [S/F] < vLIGralTAD),0,1)>} DISTINCT{<fecha_ex={"<=$(vFechaFinal)>=$(vFechaInicial)"} >} )
- Mark as New
- Bookmark
- Subscribe
- Mute
- Subscribe to RSS Feed
- Permalink
- Report Inappropriate Content
someone who can support me?