Unlock a world of possibilities! Login now and discover the exclusive benefits awaiting you.
- Qlik Community
- :
- All Forums
- :
- QlikView App Dev
- :
- Counting expression result
- Subscribe to RSS Feed
- Mark Topic as New
- Mark Topic as Read
- Float this Topic for Current User
- Bookmark
- Subscribe
- Mute
- Printer Friendly Page
- Mark as New
- Bookmark
- Subscribe
- Mute
- Subscribe to RSS Feed
- Permalink
- Report Inappropriate Content
Counting expression result
Hi all,
i have the following expression in a table..
IF(
SUM([raw_Overall Score])/COUNT(IF([raw_Overall Score]>0,[raw_Overall Score]))>=4.5,
'Legendary',
IF(
SUM([raw_Overall Score])/COUNT(IF([raw_Overall Score]>0,[raw_Overall Score]))>=3.5,
'Stella',
IF(
SUM([raw_Overall Score])/COUNT(IF([raw_Overall Score]>0,[raw_Overall Score]))>=2.5,
'Strong',
IF(
SUM([raw_Overall Score])/COUNT(IF([raw_Overall Score]>0,[raw_Overall Score]))>=1.5,
'Steady',
IF(
SUM([raw_Overall Score])/COUNT(IF([raw_Overall Score]>0,[raw_Overall Score]))>=0.5,
'Concern'
)))))
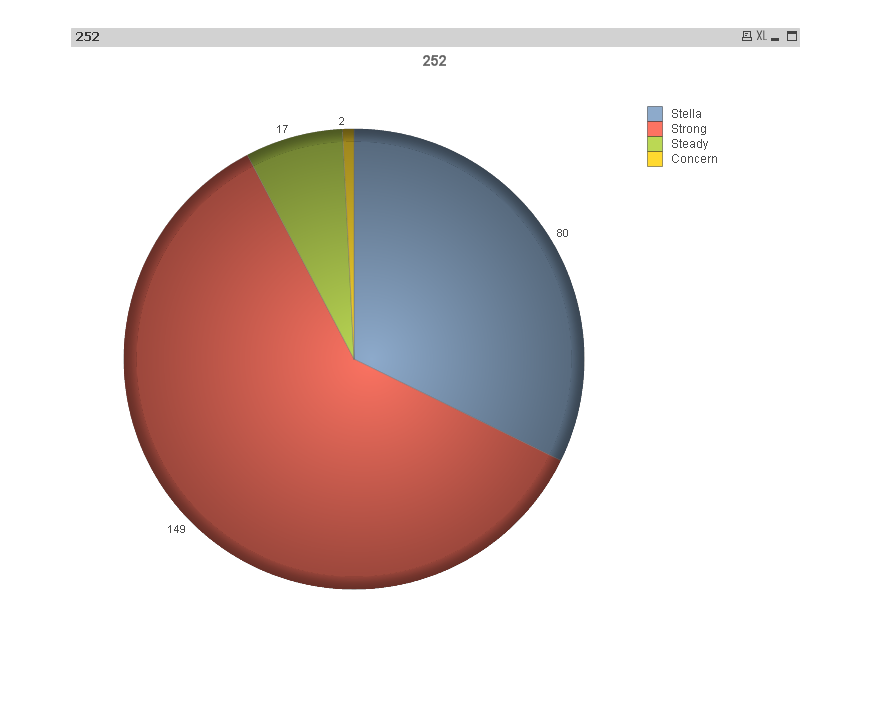
Is there a way to count the results of this expression and create a pie chart based on that count.
i.e.
get the count of 'Legendary' ,'Stella','Strong','Steady','Concern' and use it in a pie chart.
Sample attached.
Thanks
Accepted Solutions
- Mark as New
- Bookmark
- Subscribe
- Mute
- Subscribe to RSS Feed
- Permalink
- Report Inappropriate Content
- Mark as New
- Bookmark
- Subscribe
- Mute
- Subscribe to RSS Feed
- Permalink
- Report Inappropriate Content
Can't we do modelling here , Suggest by placing them in the script which would be the ideal case.
else
we can add the first expression , then use the Column(1) to play on the first expression and increment the counters.
- Mark as New
- Bookmark
- Subscribe
- Mute
- Subscribe to RSS Feed
- Permalink
- Report Inappropriate Content
This?
- Mark as New
- Bookmark
- Subscribe
- Mute
- Subscribe to RSS Feed
- Permalink
- Report Inappropriate Content
yet again, Thanks!!