Unlock a world of possibilities! Login now and discover the exclusive benefits awaiting you.
- Qlik Community
- :
- All Forums
- :
- QlikView App Dev
- :
- Re: Counts with multiple filters
- Subscribe to RSS Feed
- Mark Topic as New
- Mark Topic as Read
- Float this Topic for Current User
- Bookmark
- Subscribe
- Mute
- Printer Friendly Page
- Mark as New
- Bookmark
- Subscribe
- Mute
- Subscribe to RSS Feed
- Permalink
- Report Inappropriate Content
Counts with multiple filters
Trying to create a bar chart that will give me counts based on filters chosen for dimensions. Fields include
CSRep
Year
Month
Team Lead
Survey Type
ResponseId (distinct for each line of data)
My bar chart has CSRep and counts of Survey Types. I'm looking for those counts to reflect the Year and Month chosen. COUNT(DISTINCT [Response ID]) returns total count of rep for all months with the same amount for all Survey Types. No reflection of filters chosen. Looking for ideas.
Thanks
- Mark as New
- Bookmark
- Subscribe
- Mute
- Subscribe to RSS Feed
- Permalink
- Report Inappropriate Content
Can you please share a small sample...
- Mark as New
- Bookmark
- Subscribe
- Mute
- Subscribe to RSS Feed
- Permalink
- Report Inappropriate Content
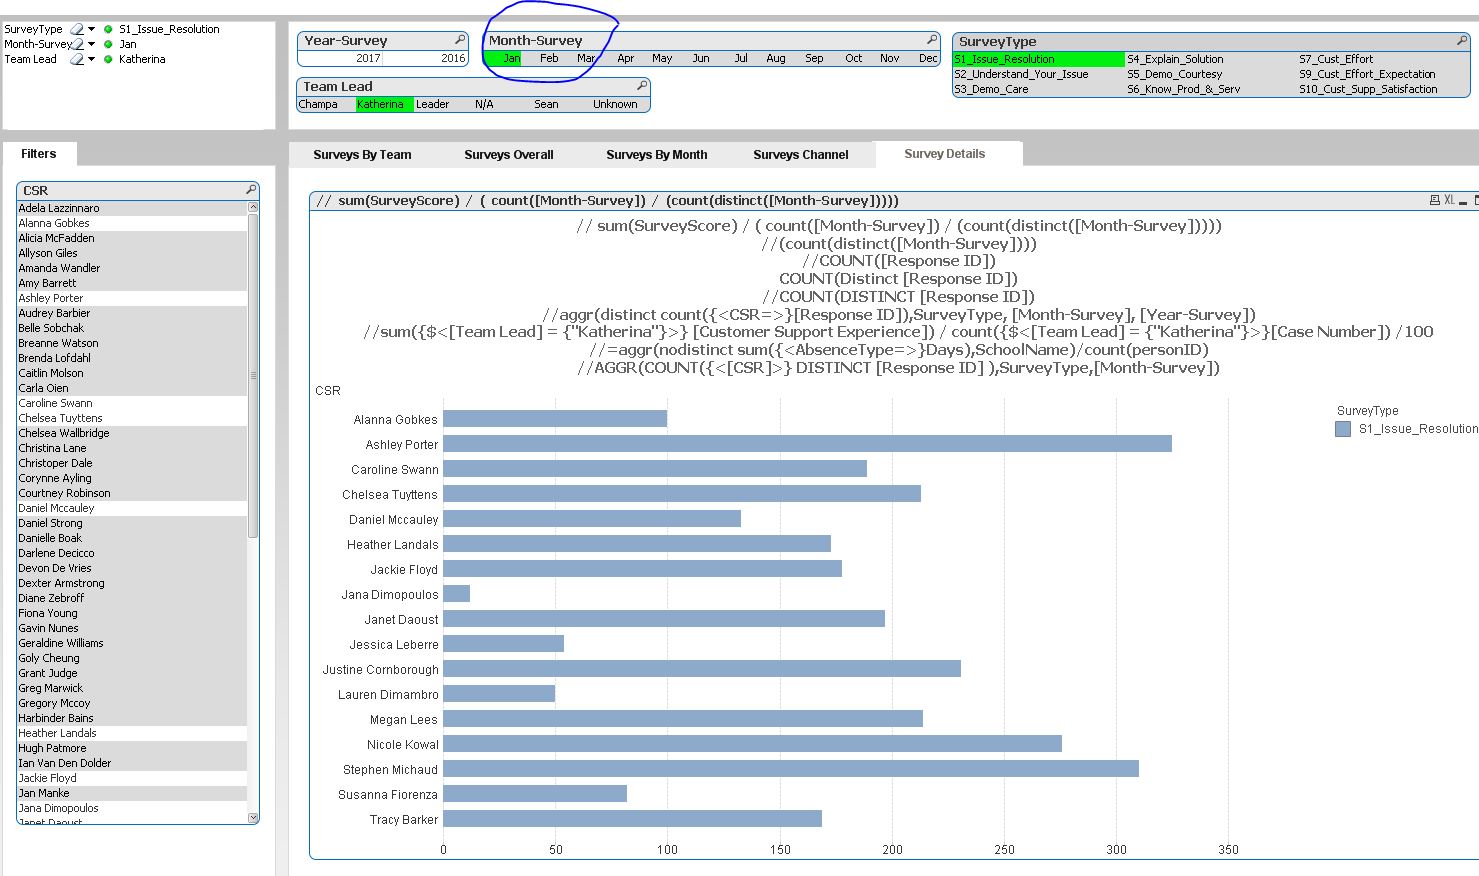
So here I've used COUNT(DISTINCT(ResponseId))
However the filter non Month_Survey is not taking into consideration as the counts represented are for 3 months total data (Jan-Mar)
- Mark as New
- Bookmark
- Subscribe
- Mute
- Subscribe to RSS Feed
- Permalink
- Report Inappropriate Content
If filters are not getting response means there could be some problem in data association. Can you share data model or you can check if month is not connected with other desired fields.