Unlock a world of possibilities! Login now and discover the exclusive benefits awaiting you.
- Qlik Community
- :
- All Forums
- :
- QlikView App Dev
- :
- Re: Create inner and outer pie chart
- Subscribe to RSS Feed
- Mark Topic as New
- Mark Topic as Read
- Float this Topic for Current User
- Bookmark
- Subscribe
- Mute
- Printer Friendly Page
- Mark as New
- Bookmark
- Subscribe
- Mute
- Subscribe to RSS Feed
- Permalink
- Report Inappropriate Content
Create inner and outer pie chart
Hi,
I have below data set,
Status Name count
A TEST 1 20
A TEST 2 15
B TEST 1 12
B TEST2 14
I want to display Status in inner pie and Name in out pie. Is this possible in Qlikview.
Thanks
- Tags:
- new_to_qlikview
- Mark as New
- Bookmark
- Subscribe
- Mute
- Subscribe to RSS Feed
- Permalink
- Report Inappropriate Content
- Mark as New
- Bookmark
- Subscribe
- Mute
- Subscribe to RSS Feed
- Permalink
- Report Inappropriate Content
Hi,
See the attached file like this ways where you have the problems.
Regards
Anand
- Mark as New
- Bookmark
- Subscribe
- Mute
- Subscribe to RSS Feed
- Permalink
- Report Inappropriate Content
Hi Anuradha,
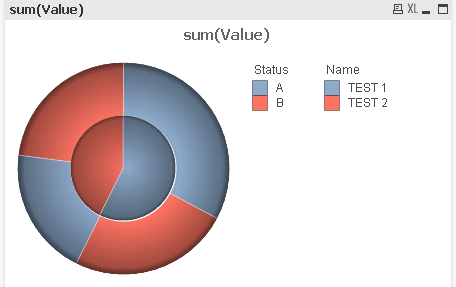
do you expect output like this ?
hope attached Qvw helps u.
- Mark as New
- Bookmark
- Subscribe
- Mute
- Subscribe to RSS Feed
- Permalink
- Report Inappropriate Content
Hi ,
That's what i want. But there is some problem. Here I have mistakenly write TEST2 insted on TEST 2
So what i want here is ,
1.Display values in each portion (values at data point)
2.use different coloures in two dimensions
3.Show frequency in legend
Is it possible
- Mark as New
- Bookmark
- Subscribe
- Mute
- Subscribe to RSS Feed
- Permalink
- Report Inappropriate Content
Hi ,
That's what i want. But there is some problem.
what i want here is ,
1.Display values in each portion (values at data point)
2.use different coloures in two dimensions
3.Show frequency in legend
Is it possible
- Mark as New
- Bookmark
- Subscribe
- Mute
- Subscribe to RSS Feed
- Permalink
- Report Inappropriate Content
about different colors and legend numbers on both the dimensions we will have to investigate