Unlock a world of possibilities! Login now and discover the exclusive benefits awaiting you.
- Qlik Community
- :
- All Forums
- :
- QlikView App Dev
- :
- Creating Master Date Column for different date col...
- Subscribe to RSS Feed
- Mark Topic as New
- Mark Topic as Read
- Float this Topic for Current User
- Bookmark
- Subscribe
- Mute
- Printer Friendly Page
- Mark as New
- Bookmark
- Subscribe
- Mute
- Subscribe to RSS Feed
- Permalink
- Report Inappropriate Content
Creating Master Date Column for different date columns in a table
Hello Experts,
I have table with multiple date columns (nearly 5 date columns are there), Now I want create one master date column for all of them because in my report i can't to show multiple list boxes for the user. If i show like that user will get confuse.
So, How to handle this issue i am not understanding. I have visited some threads also those are not useful for me
Please suggest some solutions and help me out from this task
Thank you in advance
marcowedel franky_h79vishsaggi
Regards,
B V S Sudhakar
- Mark as New
- Bookmark
- Subscribe
- Mute
- Subscribe to RSS Feed
- Permalink
- Report Inappropriate Content
HI Sudhakar,
Please provide sample data with your expected output so we will help you.
Thanks,
Arvind Patil
- Mark as New
- Bookmark
- Subscribe
- Mute
- Subscribe to RSS Feed
- Permalink
- Report Inappropriate Content
Use Canonical Dates like this:
Check this script:
- Mark as New
- Bookmark
- Subscribe
- Mute
- Subscribe to RSS Feed
- Permalink
- Report Inappropriate Content
Hi Bala,
I tried with that script but it is giving error, because i have taken the data from sql server.
so that i thought it is not possible for mapping. can you give me the suggestion
- Mark as New
- Bookmark
- Subscribe
- Mute
- Subscribe to RSS Feed
- Permalink
- Report Inappropriate Content
Hi Aravind,
Here i attached sample Excel sheet, In this table 5 to 6 date columns are there
Example: i am creating one bar chart/table for title name wise placements for this i use title name as dimension and =Count({<plcdate = {"*"}>}CandidateID) as expression
and now i have to create one list box for plcdate column
And now, again i am creating one bar chart/table for title name wise Declines for this i use title name as dimension and =Count({<Declinedate = {"*"}>}CandidateID) as expression
for this i have to create one more list box for Decline date column
Again i am creating one bar chart/table for title name wise Offered Candidates for this i use title name as dimension and =Count({<Offerdate = {"*"}>}CandidateID) as expression
for this i have to create one more list box for offer date column
But user is not accepting these many list boxes separately. they want only two list boxes year and month or hierarchy calendar list box that will apply to all date columns
This is the sample data and one of the major requirement from client
Please Help me out from this guys
Thank you in advance
- Mark as New
- Bookmark
- Subscribe
- Mute
- Subscribe to RSS Feed
- Permalink
- Report Inappropriate Content
- Mark as New
- Bookmark
- Subscribe
- Mute
- Subscribe to RSS Feed
- Permalink
- Report Inappropriate Content
Hi stalwar1,
Here i attached sample Excel sheet, In this table 5 to 6 date columns are there
Example: i am creating one bar chart/table for title name wise placements for this i use title name as dimension and =Count({<plcdate = {"*"}>}CandidateID) as expression
and now i have to create one list box for plcdate column
And now, again i am creating one bar chart/table for title name wise Declines for this i use title name as dimension and =Count({<Declinedate = {"*"}>}CandidateID) as expression
for this i have to create one more list box for Decline date column
Again i am creating one bar chart/table for title name wise Offered Candidates for this i use title name as dimension and =Count({<Offerdate = {"*"}>}CandidateID) as expression
for this i have to create one more list box for offer date column
But user is not accepting these many list boxes separately. they want only two list boxes year and month or hierarchy calendar list box that will apply to all date columns
This is the sample data and one of the major requirement from client
Please Help me out from this guys
Thank you in advance
- Mark as New
- Bookmark
- Subscribe
- Mute
- Subscribe to RSS Feed
- Permalink
- Report Inappropriate Content
Hi,
maybe one solution could be:
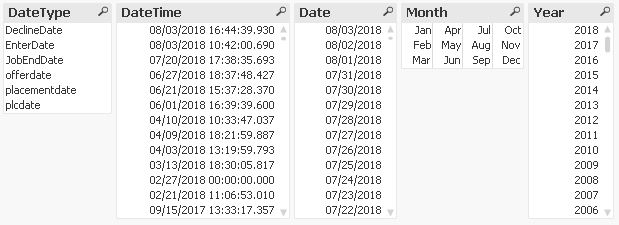
table1:
CrossTable (DateType, DateTemp)
LOAD jobid,
    EnterDate,
    JobEndDate,
    placementdate,
    plcdate,
    offerdate,
    DeclineDate
FROM [https://community.qlik.com/servlet/JiveServlet/download/1527897-334459/RMS%20Sample%20Data.xlsx] (ooxml, embedded labels, table is Sheet1);

table2:
LOAD *,
    DayName(DateTime) as Date;
LOAD jobid,
    DateType,
    Timestamp(Alt(Timestamp#(PurgeChar(DateTemp,'T'),'YYYY-MM-DDhh:mm:ss.fffffff'),Timestamp#(DateTemp,'MM/DD/YYYY hh:mm:ss TT')),'MM/DD/YYYY hh:mm:ss.fff') as DateTime
Resident table1;

DROP Table table1;

tabCalendar:
LOAD *,
    Day(Date) as Day,
    WeekDay(Date) as WeekDay,
    Week(Date) as Week,
    WeekName(Date) as WeekName,
    Month(Date) as Month,
    MonthName(Date) as MonthName,
    Dual('Q'&Ceil(Month(Date)/3),Ceil(Month(Date)/3)) as Quarter,
    QuarterName(Date) as QuarterName,
    Year(Date) as Year,
    WeekYear(Date) as WeekYear;
LOAD Date(MinDate+IterNo()-1) as Date
While MinDate+IterNo()-1 <= MaxDate;
LOAD Min(Date) as MinDate,
    Max(Date) as MaxDate
Resident table2;
hope this helps
regards
Marco