Unlock a world of possibilities! Login now and discover the exclusive benefits awaiting you.
- Qlik Community
- :
- All Forums
- :
- QlikView App Dev
- :
- Re: Creating Report for top 2 answers given by cat...
- Subscribe to RSS Feed
- Mark Topic as New
- Mark Topic as Read
- Float this Topic for Current User
- Bookmark
- Subscribe
- Mute
- Printer Friendly Page
- Mark as New
- Bookmark
- Subscribe
- Mute
- Subscribe to RSS Feed
- Permalink
- Report Inappropriate Content
Creating Report for top 2 answers given by category by country
Hi All
I need to generate a report where i have to show most frequently selected top 2 answers for 3 Categories.
Note the question is the same (question1) but the answers are different for each category
My Data consist of:
Country - Multiple countries
Category - Category1, Category2, Category3
Question - Question1
Answers - For Category1: Answer10, Answer11,Answer12, Asnwer13,Anser14, Answer15, Answer16
For Category2: Answer20, Answer21,Answer22, Asnwer23,Anser24, Answer25, Answer26
For Category3: Answer30, Answer31,Answer32, Asnwer33,Anser34, Answer35, Answer36
Reference - Unique for each line of data
For example:
Country: Japan
Category1 : out of 32 answers for Question1
with Answer10 - 4 times
Answer11 - 9 times
Answer12 - 3 times
Answer13 - 12 times
Answer14 - 0 times
Answer15 - 2 times
Answer16 - 2 times
Japan for Category1 - Answer13 (37.5%) - Answer11 (28.12%)
I have included the inline data as sample for one country.
The expected report should look something like this
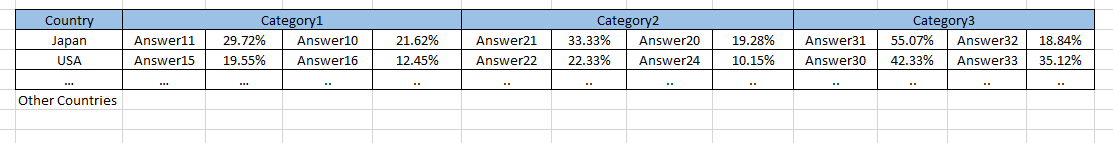
Note that The percentages next to Each Answer can be either on a seperate column or concatenated with the text: Answer11 (29.72%)
Thank you all for your guidance
- Mark as New
- Bookmark
- Subscribe
- Mute
- Subscribe to RSS Feed
- Permalink
- Report Inappropriate Content
Hi boghos, I attach a script solution, maybe it's needed to add 'Question' field to the grouping for precalculate the ranks.
- Mark as New
- Bookmark
- Subscribe
- Mute
- Subscribe to RSS Feed
- Permalink
- Report Inappropriate Content
Hi Boghos,
With the data you posted you can create this pivot table:
| Category | Category1 | Category2 | Category3 | |||||||||
|---|---|---|---|---|---|---|---|---|---|---|---|---|
| Country | Top | % | 2nd | % | Top | % | 2nd | % | Top | % | 2nd | % |
| Japan | Answer11 | 29.73% | Answer10 | 21.62% | Answer21 | 33.33% | Answer20 | 19.30% | Answer31 | 55.07% | Answer32 | 18.84% |
Dimensions are Category and Country
Expressions are:
Top: Aggr(if(Rank(Count(Answers),1,1)=1,Answers),Category,Country,Answers)
%: Aggr(if(Rank(Count(Answers),1,1)=1,Count(Answers)),Category,Country,Answers)/Count(Answers)
2nd: Aggr(if(Rank(Count(Answers),1,1)=2,Answers),Category,Country,Answers)
%: Aggr(if(Rank(Count(Answers),1,1)=2,Count(Answers)),Category,Country,Answers)/Count(Answers)
Regards
Andrew
- Mark as New
- Bookmark
- Subscribe
- Mute
- Subscribe to RSS Feed
- Permalink
- Report Inappropriate Content
Thank you
- Mark as New
- Bookmark
- Subscribe
- Mute
- Subscribe to RSS Feed
- Permalink
- Report Inappropriate Content
Dear Andrew
Sorry if i should have added this as a reply to the original post rather that a reply to already answered (and marked as correct) question.
But i'm hopping that at least you will notice it.
Your original Answers had to modify them slightly to the following:
=Aggr(if(Rank(Count({<Questions={'Question1'},Answers-={''}>} Answers),1,1)=1,Answers),Category,Country,Answers)
=Aggr(if(Rank(Count({<Questions={'Question1'},Answers-={''}>} Answers),1,1)=1,Count({<Questions={'Question1'}>} Answers)),Category, Country,Answers)/Count({<Questions={'Question1'},Answers-={''}>} Answers)
since some answers for question1 where left blank i added the part {<Questions={'Question1'},Answers-={''}>} since i don't want blank answers taken into conisderation.
I have an additional requeirement:
Each survey (in addition to Question1) has Question2 where possible answers are 1,2,3,4,5.
We want to keep the same logic as above but only for surveys that have Question2 answered 4 and below(exclude answer 5).
Tried this for the count: P({<Questions={'Question2'}, Answers-={'5'}>}) * P({<Questions={'Question1'}, Answers-={''}>})
But for some reason i could not get it right
Can you please advise
thank you so much