Unlock a world of possibilities! Login now and discover the exclusive benefits awaiting you.
- Qlik Community
- :
- All Forums
- :
- QlikView App Dev
- :
- Creating different kinds of charts and representat...
- Subscribe to RSS Feed
- Mark Topic as New
- Mark Topic as Read
- Float this Topic for Current User
- Bookmark
- Subscribe
- Mute
- Printer Friendly Page
- Mark as New
- Bookmark
- Subscribe
- Mute
- Subscribe to RSS Feed
- Permalink
- Report Inappropriate Content
Creating different kinds of charts and representating data
Hi All
I want to create different types of charts especially as below for best representation.
can we build charts as below
showing in the below way
top2
jan apple 20
mango 30
top2
feb apple 40
mango 20
..............................
top2
dec grape 12
I have data as below
load * inline[
fruits, items, month
apple, 20, jan
apple,30, jan
apple, 40, feb
apple, 50, mar
apple, 60, apr
mango, 10, jan
mango, 20, feb
mango, 35, mar
mango, 5, feb
grape, 7, mar
grape, 50, apr
grape, 12, dec ];
- Mark as New
- Bookmark
- Subscribe
- Mute
- Subscribe to RSS Feed
- Permalink
- Report Inappropriate Content
Gauges are quite seldom the best choice to visualize data. To get more insights regarding to visualizations I suggest the book:
Creating Stunning Dashboards with QlikView (October 2015)
Julian Villafuerte
ASIN: B017YC72MU
and also the books from Karl Pover are really helpful to this topic: Books and literature.
- Marcus
- Mark as New
- Bookmark
- Subscribe
- Mute
- Subscribe to RSS Feed
- Permalink
- Report Inappropriate Content
Is there anyway that we can represent top 2 values top 3 values in the above charts
- Mark as New
- Bookmark
- Subscribe
- Mute
- Subscribe to RSS Feed
- Permalink
- Report Inappropriate Content
The most chart-types support the restriction on the top/flop of various things (within the document properties in tab limitations) but not the pivot or gauges - for them you will need to calculate the top with some kind of aggr-function like this one: Re: Aggr.....................#$£%@!!! or Using Aggr Function Top N.
- Marcus
- Mark as New
- Bookmark
- Subscribe
- Mute
- Subscribe to RSS Feed
- Permalink
- Report Inappropriate Content
Hi John,
within QlikView you have a variety of Dashboards, what Kind of Dashboard you want to use, depends on your Business Environment.
Within QlikView: Startpage > Below: Ressources: View more examples of Dashboards
i hope that helps
beck
- Mark as New
- Bookmark
- Subscribe
- Mute
- Subscribe to RSS Feed
- Permalink
- Report Inappropriate Content
Hi Beck i went thorough the docs and i'm unable to find the best chart for my business i mean
i have to choose between charts
my client want the below kind of charts

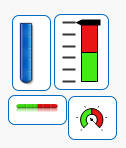
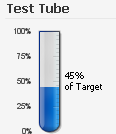
i have a simple percentage value
ie %ge of items in a particular month
can i build a testtube with that
i what exact cases can i use these gauge charts
- Mark as New
- Bookmark
- Subscribe
- Mute
- Subscribe to RSS Feed
- Permalink
- Report Inappropriate Content
Ah ok,
check this:
QlikView | Charts | Gauge Chart - YouTube
Gauges you can use to Show any Ratio in financial Area, for instance like : Investment-Ratio, Working Capital - Ration, equity-Ratio
i hope that helps
beck
- Mark as New
- Bookmark
- Subscribe
- Mute
- Subscribe to RSS Feed
- Permalink
- Report Inappropriate Content
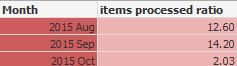
Hi Beck
I have data like this in a straight table
it is the best representation to go for gauge chart'
- Mark as New
- Bookmark
- Subscribe
- Mute
- Subscribe to RSS Feed
- Permalink
- Report Inappropriate Content
Hi John,
as i see, if you have such data, you can surely use the gauge
beck