Unlock a world of possibilities! Login now and discover the exclusive benefits awaiting you.
- Qlik Community
- :
- All Forums
- :
- QlikView App Dev
- :
- Creating multiple buttons for multiple selections
- Subscribe to RSS Feed
- Mark Topic as New
- Mark Topic as Read
- Float this Topic for Current User
- Bookmark
- Subscribe
- Mute
- Printer Friendly Page
- Mark as New
- Bookmark
- Subscribe
- Mute
- Subscribe to RSS Feed
- Permalink
- Report Inappropriate Content
Creating multiple buttons for multiple selections
Hi all
I have the attached sales data and I am trying to create something like shown below (the graphs only reflect sample values):
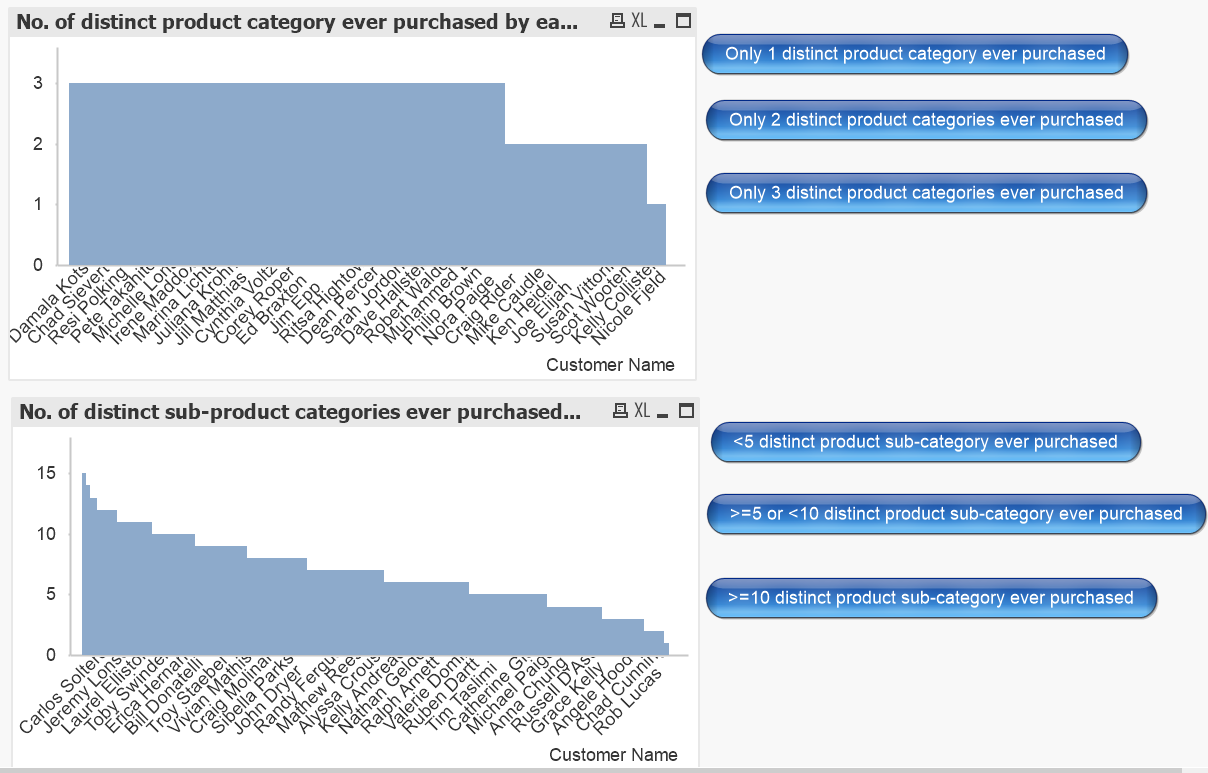
The problem is that the buttons are mutual exclusive. They are not linked. For example, if I select "only 3 distinct product categories ever purchased" and then click on ">= distinct product sub-categories ever purchased", it does not work.
Can anyone help??
Thanks!
- Mark as New
- Bookmark
- Subscribe
- Mute
- Subscribe to RSS Feed
- Permalink
- Report Inappropriate Content
i think that each button may have a clear command? if you remove that, you may get what you want to do.
- Mark as New
- Bookmark
- Subscribe
- Mute
- Subscribe to RSS Feed
- Permalink
- Report Inappropriate Content
Would you be able to share your qvw sample instead of the excel database?
- Mark as New
- Bookmark
- Subscribe
- Mute
- Subscribe to RSS Feed
- Permalink
- Report Inappropriate Content
Hi all
I realised that the bar graphs in my earlier image are wrongly labelled. It should be max. no. of distinct product category ever purchased.
Likewise, the buttons should also be labelled Max of X distinct product category ever purchased, etc.
Attached is the qvw file with the correct graphs and buttons.
So in case I have confused anyone by now, the question is how can we make the buttons interrelate in such a way that they can act as filters, one of top of the other, and also take in new filters such as month, without having to go thru load script. Currently, only 1 button can work at any point of time.
Thanks!