Unlock a world of possibilities! Login now and discover the exclusive benefits awaiting you.
- Qlik Community
- :
- All Forums
- :
- QlikView App Dev
- :
- Cross table question
- Subscribe to RSS Feed
- Mark Topic as New
- Mark Topic as Read
- Float this Topic for Current User
- Bookmark
- Subscribe
- Mute
- Printer Friendly Page
- Mark as New
- Bookmark
- Subscribe
- Mute
- Subscribe to RSS Feed
- Permalink
- Report Inappropriate Content
Cross table question
Hello,
I am really new to Qlikview and I have a question which will seem to most of you really simple.
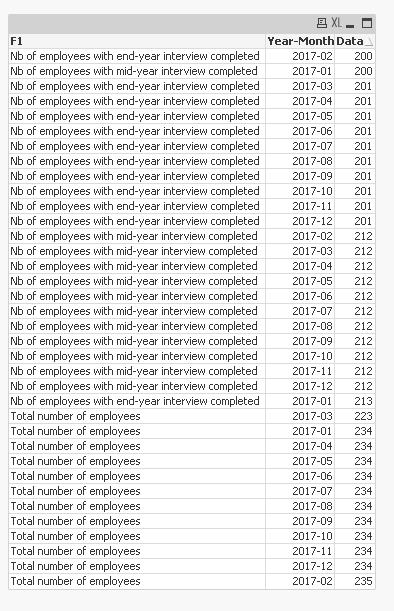
I would like to import data from Excel using the Wizard. My problem is that my table is a cross table, with columns for the different months of the year, with several fields to be imported in different lines (see test file attached). I use the Crosstable function, this works fine. However I do not know how to import so that all values in lines 2 to 4 are imported in different fields and not as a value of the same F2 field (I am not sure this is clear...). I would like the values to be usable for calculations.
Here is the script I used :
Directory;
CrossTable([Year-Month], Data)
LOAD F1,
[2017-01],
[2017-02],
[2017-03],
[2017-04],
[2017-05],
[2017-06],
[2017-07],
[2017-08],
[2017-09],
[2017-10],
[2017-11],
[2017-12]
FROM
[..\Desktop\QV_test.xlsx]
(ooxml, embedded labels, table is Feuil1);
I guess the solution is quite simple but after some hours of research I did not find it.
Any help will be appreciated.
- « Previous Replies
-
- 1
- 2
- Next Replies »
- Mark as New
- Bookmark
- Subscribe
- Mute
- Subscribe to RSS Feed
- Permalink
- Report Inappropriate Content
Not sure I understand the concern, but this will work (only slightly enhanced from what you have)
Table:
CrossTable([Year-Month], Data)
LOAD F1,
[2017-01],
[2017-02],
[2017-03],
[2017-04],
[2017-05],
[2017-06],
[2017-07],
[2017-08],
[2017-09],
[2017-10],
[2017-11],
[2017-12]
FROM
[..\..\Downloads\QV_test.xlsx]
(ooxml, embedded labels, table is Feuil1);
FinalTable:
NoConcatenate
LOAD F1,
Date#([Year-Month], 'YYYY-MM') as [Year-Month],
Data
Resident Table;
DROP Table Table;
- Mark as New
- Bookmark
- Subscribe
- Mute
- Subscribe to RSS Feed
- Permalink
- Report Inappropriate Content
Or is this the goal?

Script
Table:
LOAD Date#(F1, 'YYYY-MM') as [Year-Month],
[Nb of employees with mid-year interview completed],
[Nb of employees with end-year interview completed],
[Total number of employees]
FROM
[..\..\Downloads\QV_test.xlsx]
(ooxml, embedded labels, table is Feuil1, filters(
Transpose()
));
- Mark as New
- Bookmark
- Subscribe
- Mute
- Subscribe to RSS Feed
- Permalink
- Report Inappropriate Content
Thanks for the super quick answer 
First answer : I do see the difference with what I did although the script is more complex, but the table at the end is more complicated.
Second answer : yes, this is what I would need. Let me try it and I will let you know. Can you explain the script?
Actually my project is bigger and I have just posted a very simple example as a demo. In the real example there are at least 50 rows and I would like to avoid to have to write the names of the fields in hard code in the script.
- Mark as New
- Bookmark
- Subscribe
- Mute
- Subscribe to RSS Feed
- Permalink
- Report Inappropriate Content
You won't have to type anything.... Look below
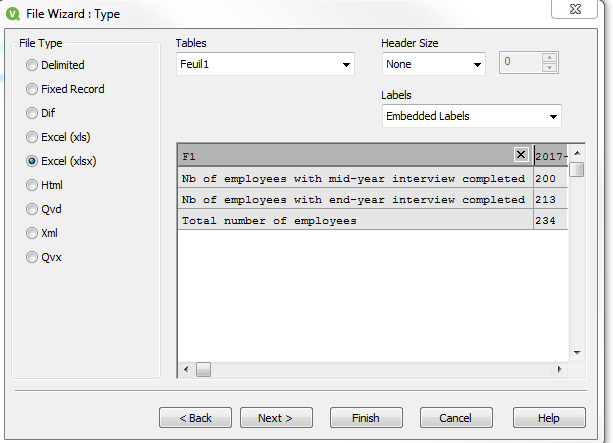
1) Select the file, make sure labels are Embedded Labels
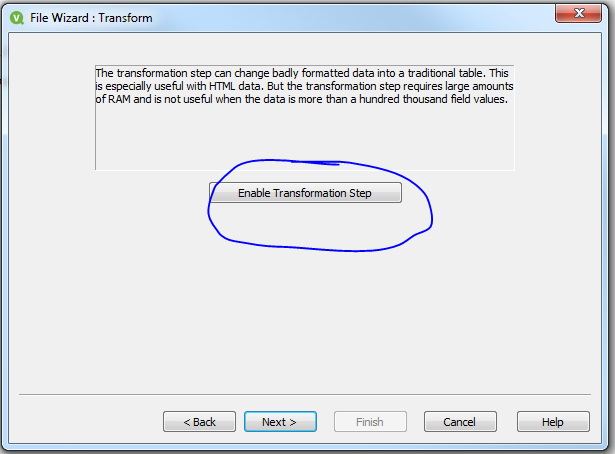
2) Select next and click on Enable Transformation Step
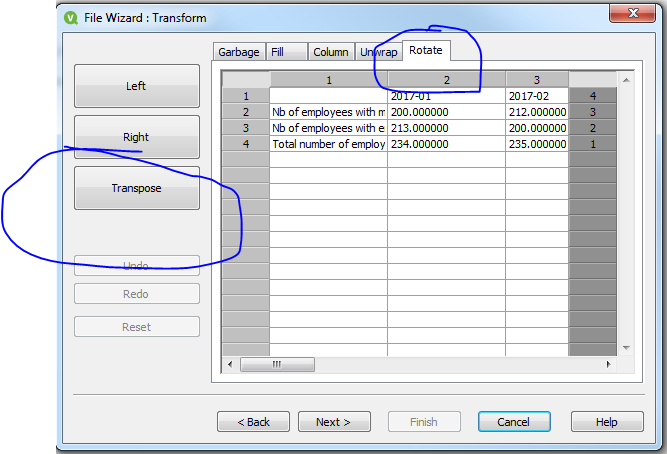
3) Go to the rotate tab and click on Transpose
4) Click Next and Finish to get the script
- Mark as New
- Bookmark
- Subscribe
- Mute
- Subscribe to RSS Feed
- Permalink
- Report Inappropriate Content
The solution provided seems to work. However it could be difficult at a larger scale.
I have more than 50 indicators in rows and more than 150 "sites" which are reporting data.
I have created a example file to show you how it could look like.
My main concern is that I would have to list all indicator names in the script and I would prefer if the script could read the indicator names automatically
- Mark as New
- Bookmark
- Subscribe
- Mute
- Subscribe to RSS Feed
- Permalink
- Report Inappropriate Content
I understood the transpose function which is works in the simple example I gave initially.
However I cannot make it work when I have added a new column for the site name, then the table is all mixed up.
Any solution for me ?
- Mark as New
- Bookmark
- Subscribe
- Mute
- Subscribe to RSS Feed
- Permalink
- Report Inappropriate Content
The best way to load this data would be to use The Crosstable Load
- Mark as New
- Bookmark
- Subscribe
- Mute
- Subscribe to RSS Feed
- Permalink
- Report Inappropriate Content
So then we are back to my initial question : how can you download a crosstable with multiple lines ?
Any solution for me, anyone ?
- Mark as New
- Bookmark
- Subscribe
- Mute
- Subscribe to RSS Feed
- Permalink
- Report Inappropriate Content
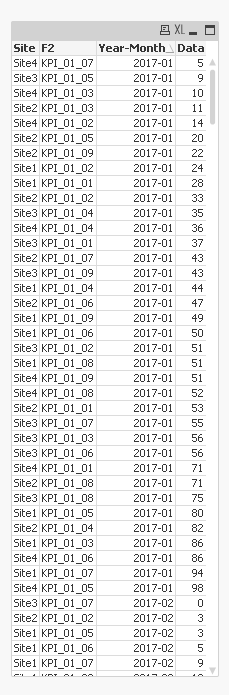
Personally, I would load your data like this
Table:
CrossTable([Year-Month], Data, 2)
LOAD Site,
F2,
[2017-01],
[2017-02],
[2017-03],
[2017-04],
[2017-05],
[2017-06],
[2017-07],
[2017-08],
[2017-09],
[2017-10],
[2017-11],
[2017-12]
FROM
[..\..\Downloads\QV_test2.xlsx]
(ooxml, embedded labels, table is Feuil1);
FinalTable:
NoConcatenate
LOAD Site,
F2,
Date#([Year-Month], 'YYYY-MM') as [Year-Month],
Data
Resident Table;
DROP Table Table;
And then use Pivot table to visualize the data may be like this
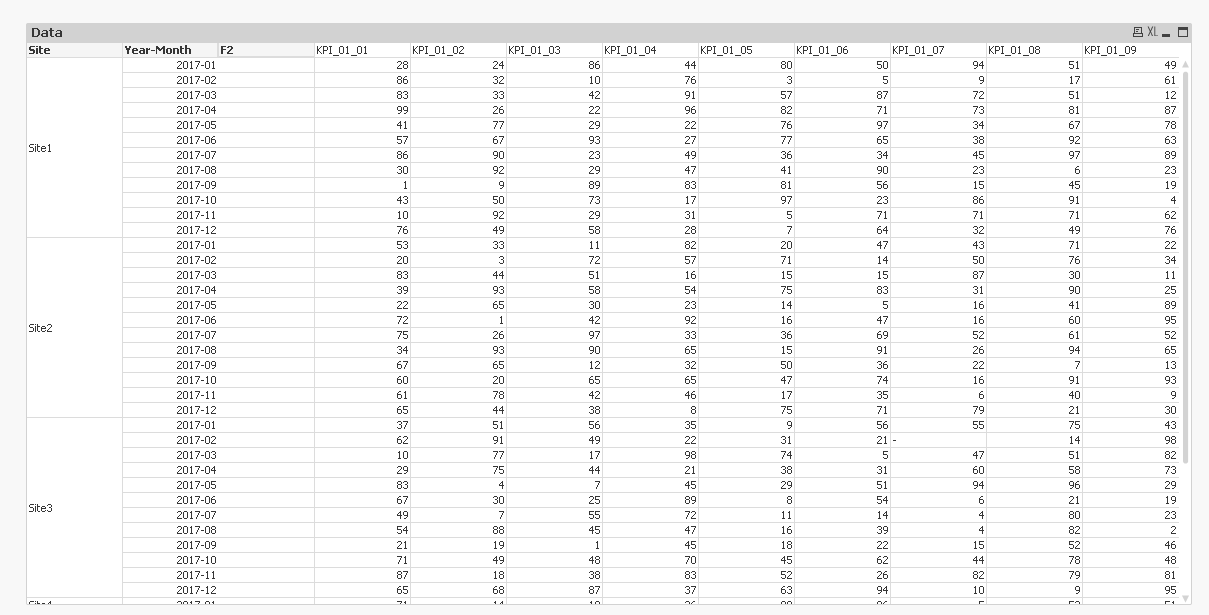
Or however you wish to view it.
- « Previous Replies
-
- 1
- 2
- Next Replies »