Unlock a world of possibilities! Login now and discover the exclusive benefits awaiting you.
- Qlik Community
- :
- All Forums
- :
- QlikView App Dev
- :
- Re: Cumulative Sales for Products over multiple ye...
- Subscribe to RSS Feed
- Mark Topic as New
- Mark Topic as Read
- Float this Topic for Current User
- Bookmark
- Subscribe
- Mute
- Printer Friendly Page
- Mark as New
- Bookmark
- Subscribe
- Mute
- Subscribe to RSS Feed
- Permalink
- Report Inappropriate Content
Cumulative Sales for Products over multiple years
Hi.
I have a table that shows Year,Product, and Sales. I need to create a cumulative sales column for each product by different Years.
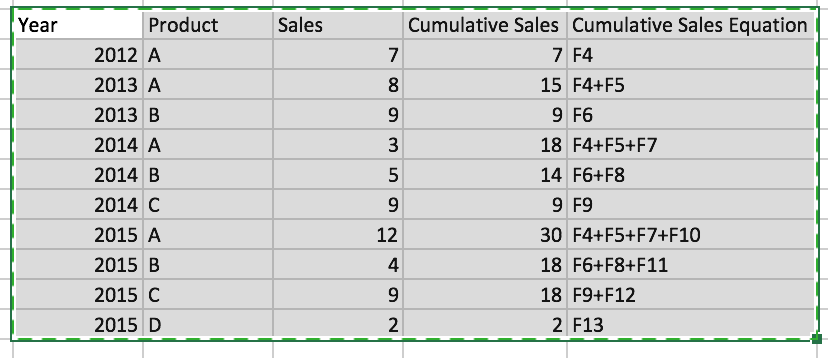
I need to create set analysis to create the "Cumulative Sales" Column. I have included the equations for cumulative sales in the "Cumulative Sales Equation".
Thanks in advance
- « Previous Replies
-
- 1
- 2
- Next Replies »
- Mark as New
- Bookmark
- Subscribe
- Mute
- Subscribe to RSS Feed
- Permalink
- Report Inappropriate Content
Seems like the same thing you asked here:
- Mark as New
- Bookmark
- Subscribe
- Mute
- Subscribe to RSS Feed
- Permalink
- Report Inappropriate Content
Sunny,
This is working. But when I select a year like 2013 it seems like the logic breaks.
Any ideas?
- Mark as New
- Bookmark
- Subscribe
- Mute
- Subscribe to RSS Feed
- Permalink
- Report Inappropriate Content
Try this:
Aggr(RangeSum(Above(Sum({<Year, Vintage>}Revenue), 0, RowNo())), Vintage, Year)
and see if that helps
- Mark as New
- Bookmark
- Subscribe
- Mute
- Subscribe to RSS Feed
- Permalink
- Report Inappropriate Content
I agree with sunny's reply
please try his formula like ?
Aggr(RangeSum(Above(Sum{1}(Revenue), 0, RowNo())), Vintage, Year)
- Mark as New
- Bookmark
- Subscribe
- Mute
- Subscribe to RSS Feed
- Permalink
- Report Inappropriate Content
Alluraiah,
This is working correctly. But when I put this into a KPI object I am getting a Null.
Thanks,
- Mark as New
- Bookmark
- Subscribe
- Mute
- Subscribe to RSS Feed
- Permalink
- Report Inappropriate Content
Sunny,
This is working correctly. But when I put this into a KPI object I am getting a Null.
Thanks,
- Mark as New
- Bookmark
- Subscribe
- Mute
- Subscribe to RSS Feed
- Permalink
- Report Inappropriate Content
KPI shows a single value, what do you expect to see in your KPI?
- Mark as New
- Bookmark
- Subscribe
- Mute
- Subscribe to RSS Feed
- Permalink
- Report Inappropriate Content
try
Sum(Aggr(RangeSum(Above(Sum({<Year, Vintage>}Revenue), 0, RowNo())), Vintage, Year))
hope this helps
- Mark as New
- Bookmark
- Subscribe
- Mute
- Subscribe to RSS Feed
- Permalink
- Report Inappropriate Content
KPI shows a single value, what do you expect to see in your KPI?
- « Previous Replies
-
- 1
- 2
- Next Replies »