Unlock a world of possibilities! Login now and discover the exclusive benefits awaiting you.
- Qlik Community
- :
- All Forums
- :
- QlikView App Dev
- :
- Cumulative sum of values at the end of a line grap...
- Subscribe to RSS Feed
- Mark Topic as New
- Mark Topic as Read
- Float this Topic for Current User
- Bookmark
- Subscribe
- Mute
- Printer Friendly Page
- Mark as New
- Bookmark
- Subscribe
- Mute
- Subscribe to RSS Feed
- Permalink
- Report Inappropriate Content
Cumulative sum of values at the end of a line graph
Hi Experts,
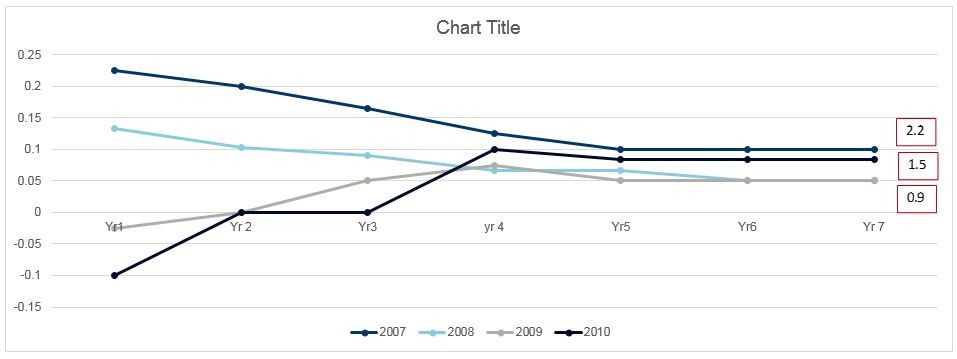
I have the below requirement. I need to show the sum of all the values per year at the end of each line( the box in red).
Can you please help ?
Thanks in advance.
Regards,
Nayana
- Tags:
- new_to_qlikview
- Mark as New
- Bookmark
- Subscribe
- Mute
- Subscribe to RSS Feed
- Permalink
- Report Inappropriate Content
Can you post a small qlikview document that illustrates the problem?
talk is cheap, supply exceeds demand
- Mark as New
- Bookmark
- Subscribe
- Mute
- Subscribe to RSS Feed
- Permalink
- Report Inappropriate Content
You can make each expression into a Dual-value and let the text part be the Sum(TOTAL .... ) if the dimension is the last dimension value:
Dual(
If( RowNo(TOTAL) = NoOfRows(relativeYear) , Null() , Sum(TOTAL measureForYearNN ) )
, Sum( measureForYearNN )
)
- Mark as New
- Bookmark
- Subscribe
- Mute
- Subscribe to RSS Feed
- Permalink
- Report Inappropriate Content
Hi,
The lines shows the value of a column with respect to years.
Each year has a 7 year data format-hence year1-year7 format.
What is required now is that the sum of all values for any year should show up.
Client has asked for sum in a red box at the end of each line but anything similar would work.
Thanks in advance.
Regards
- Mark as New
- Bookmark
- Subscribe
- Mute
- Subscribe to RSS Feed
- Permalink
- Report Inappropriate Content
Found this awesome video that explains it perfectly.
https://www.youtube.com/watch?v=AlT_jAMsiGU
Credit to: Christof Schwarz
The basic idea is this:
You need to Create 2 variables in Qlik Sense. I just used the editors variable creation window.
Variable 1:
Name:accum
Value:='RangeSum(Above('
Variable 2:
Name:/accum
Value:=',0,RowNo(TOTAL)))'
Usage:
$(accum)(Your Measure)$(/accum)
NOTE:
If you are going to create the variable using the SET function, in the script. Then you need to change these (' ') to these (" ").
Let me know if it helped.
Nico