Unlock a world of possibilities! Login now and discover the exclusive benefits awaiting you.
- Qlik Community
- :
- All Forums
- :
- QlikView App Dev
- :
- Customising Qlikview axis
- Subscribe to RSS Feed
- Mark Topic as New
- Mark Topic as Read
- Float this Topic for Current User
- Bookmark
- Subscribe
- Mute
- Printer Friendly Page
- Mark as New
- Bookmark
- Subscribe
- Mute
- Subscribe to RSS Feed
- Permalink
- Report Inappropriate Content
Customising Qlikview axis
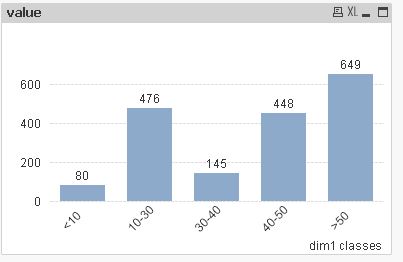
I am trying to create a bar chart with a customised axis.
On the x-axis, I have data ranging from 0 to 100. However, I want the x-axis labels to be <10, 10-30, 40-50, >50.
How could I do this?
Many thanks.
- Mark as New
- Bookmark
- Subscribe
- Mute
- Subscribe to RSS Feed
- Permalink
- Report Inappropriate Content
Have a look on the function class() - this comes your question quite near and maybe it's even more suitable for you.
class(sum(value), 10)
- Marcus
- Mark as New
- Bookmark
- Subscribe
- Mute
- Subscribe to RSS Feed
- Permalink
- Report Inappropriate Content
I've tried to use class but I still couldn't figure out how to rename the labels - i would prefer them to be "<10mins, 10-30 mins" and so on
- Mark as New
- Bookmark
- Subscribe
- Mute
- Subscribe to RSS Feed
- Permalink
- Report Inappropriate Content
Within the third parameter from class() you could customize how the delimiter from the buckets should look like. But they will be identically for each bucket. If you really want a different char(s) for the beginning and ending of the buckets you would need to adjust the buckets with something like this:
if(num(class(sum(value),10)) = 10, replace(class(sum(value),10), ....
and/or some further string-functions. If you only have a few buckets (and which you then needs to adjust) the advantage from the class-function against a normal nested-if-loop approach is quite less. But by many buckets which might be controlled by variables or are you handled with big amounts of the data everything the nested if-loops will be easier and better perform.
If you takes a further look on the default interpretation from class() they might be practically enough for most of your user.
- Marcus
- Mark as New
- Bookmark
- Subscribe
- Mute
- Subscribe to RSS Feed
- Permalink
- Report Inappropriate Content
Hi,
one solution could be also:
= If(dim1<10,Dual('<10',1),
    If(dim1>=10 and dim1<30,Dual('10-30',10),
        If(dim1>=30 and dim1<40,Dual('30-40',30),
          If(dim1>=40 and dim1<50,Dual('40-50',40),
              If(dim1>=50,Dual('>50',50)
    )))))
hope this helps
regards
Marco