Unlock a world of possibilities! Login now and discover the exclusive benefits awaiting you.
- Qlik Community
- :
- All Forums
- :
- QlikView App Dev
- :
- Re: Customized data points in the graph
- Subscribe to RSS Feed
- Mark Topic as New
- Mark Topic as Read
- Float this Topic for Current User
- Bookmark
- Subscribe
- Mute
- Printer Friendly Page
- Mark as New
- Bookmark
- Subscribe
- Mute
- Subscribe to RSS Feed
- Permalink
- Report Inappropriate Content
Customized data points in the graph
Hi,
In my Qlikview line graph I've enabled data points over a period of 12 months that depicts a percentage. This is also the expression used in the graph. FCR% = sum(a)/sum(b), represented as a %. Now I'm trying to represent the number of records in the monthly data points i.e count (field x) in addition to the percentage shown. I've tried this by addition another expression however this had distorted the view. Please help.
Graph
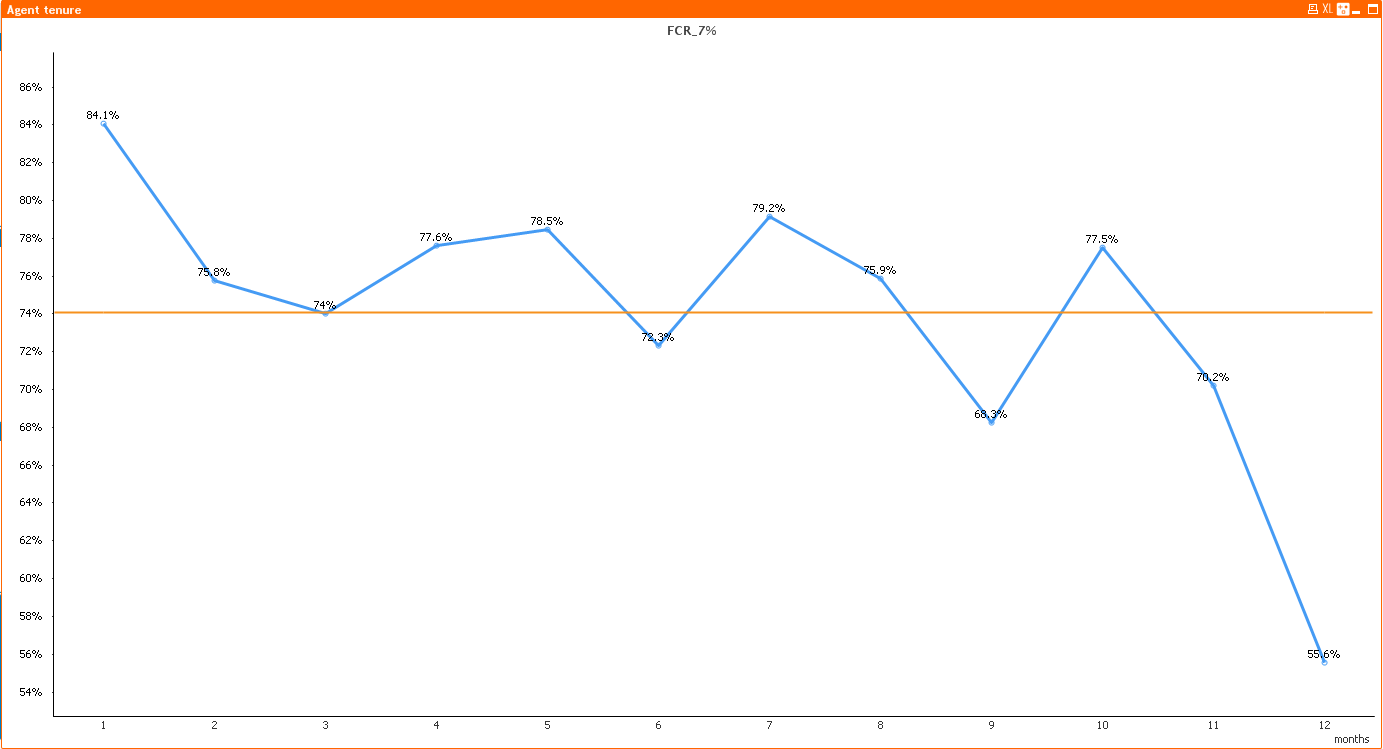
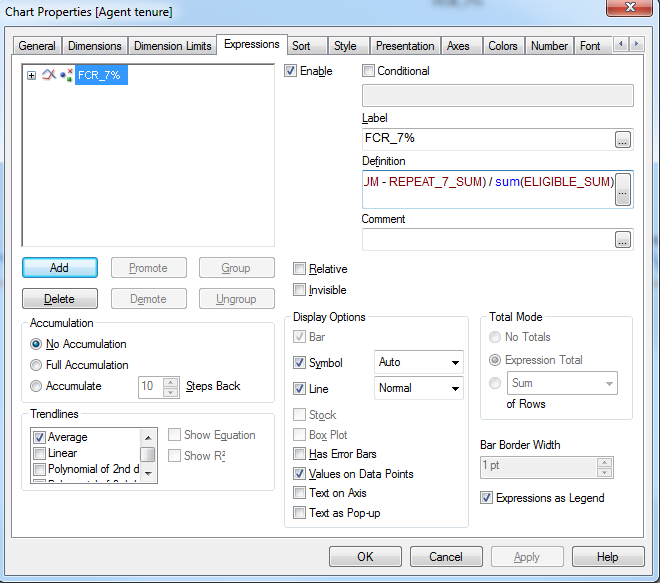
FCR_7% expression and shown as Values on Data Points, checked.
- Tags:
- new_to_qlikview
- « Previous Replies
-
- 1
- 2
- Next Replies »
- Mark as New
- Bookmark
- Subscribe
- Mute
- Subscribe to RSS Feed
- Permalink
- Report Inappropriate Content
Like this?
- Mark as New
- Bookmark
- Subscribe
- Mute
- Subscribe to RSS Feed
- Permalink
- Report Inappropriate Content
Hi,
Write an expression for the desired value and select only values on Data Points in Expression Tab.
- Mark as New
- Bookmark
- Subscribe
- Mute
- Subscribe to RSS Feed
- Permalink
- Report Inappropriate Content
Hi Manish, I tried the expression you provided but its still does not generating the output. My expressions are as follow,
FCR% = Sum (ELIGIBLE_SUM - REPEAT_7_SUM) / sum(ELIGIBLE_SUM)
No. of agents = Aggr(Num(SUM(ELIGIBLE_SUM - REPEAT_7_SUM)/SUM(ELIGIBLE_SUM),'#0%') & '--- ' &count(AGENT_AGS),Agents)
Note I want the count of agents, that had values for two fields used to compute FCR %. Two fields used ELIGIBLE_SUM and REPEAT_7_SUM.
Apologies upfront if I was not very clear. I'm new to the Qlikview community.
- Mark as New
- Bookmark
- Subscribe
- Mute
- Subscribe to RSS Feed
- Permalink
- Report Inappropriate Content
Thanks. Would you have an example of how this can be achieved? I copied the fields above to what I was referring to. If you have an example it would really help.
- Mark as New
- Bookmark
- Subscribe
- Mute
- Subscribe to RSS Feed
- Permalink
- Report Inappropriate Content
Hi,
PSA. It may help you.
Thanks
- Mark as New
- Bookmark
- Subscribe
- Mute
- Subscribe to RSS Feed
- Permalink
- Report Inappropriate Content
What is your Dimension?
Can you provide 5 to 10 lines sample data?
- Mark as New
- Bookmark
- Subscribe
- Mute
- Subscribe to RSS Feed
- Permalink
- Report Inappropriate Content
Hi Guys,
I've attached a sample data set sourced for the graph and the Qlikview file. Just source the input file to the sample xlsx. Dimension is on Months.
As you can see the percentage on the individual data points is shown by FCR % field. I need to incorporate how many unique records were made up to show the percentage in each data point. Thanks.
- Mark as New
- Bookmark
- Subscribe
- Mute
- Subscribe to RSS Feed
- Permalink
- Report Inappropriate Content
Hi Hari,
I have trouble opening the file with below error. I've included a sample data set plus the original qlikview file used. Can you help?

- Mark as New
- Bookmark
- Subscribe
- Mute
- Subscribe to RSS Feed
- Permalink
- Report Inappropriate Content
Hi,
you are using Desktop Personal edition. So you can open only three QVW files which were developed in other mechine.
If you want to open open more you need to have Named CAL Leasing or PE License. For your Convenience i'm addings Script and snap shot of the UI Objects here.
Script
Sample:
LOAD * INLINE [
Satet, Product, Sales
AP, 101, 500
AP, 102, 200
DEL, 11, 200
DEL, 15, 130
DEL, 12, 145
UP, 356, 92
TN, 201, 65
TN, 202, 55
TN, 203, 96
];
UI
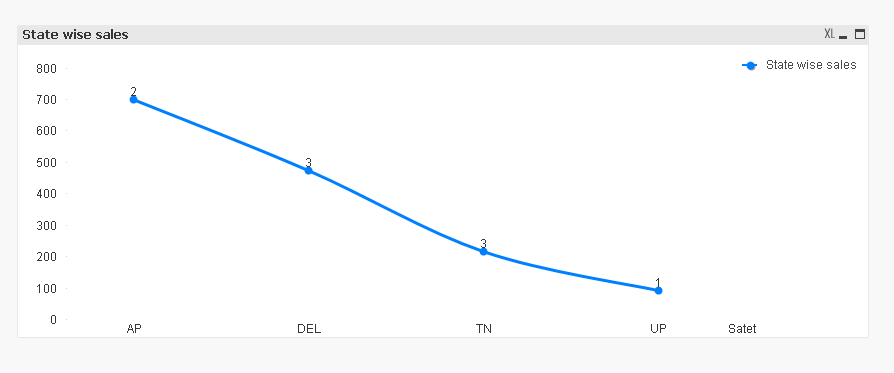
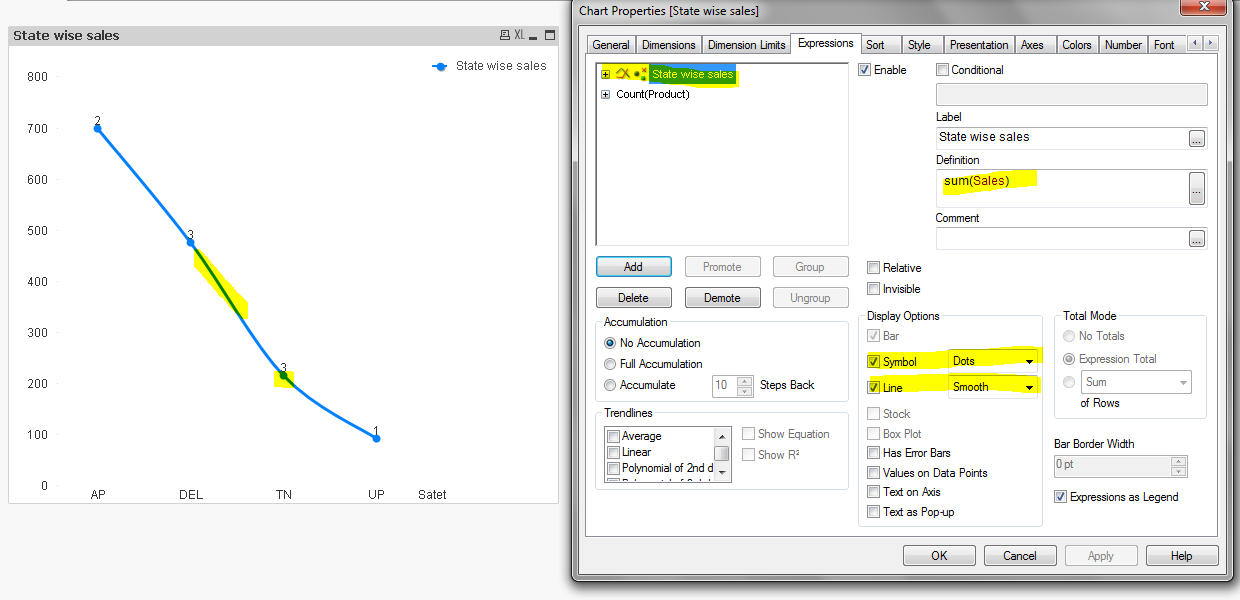
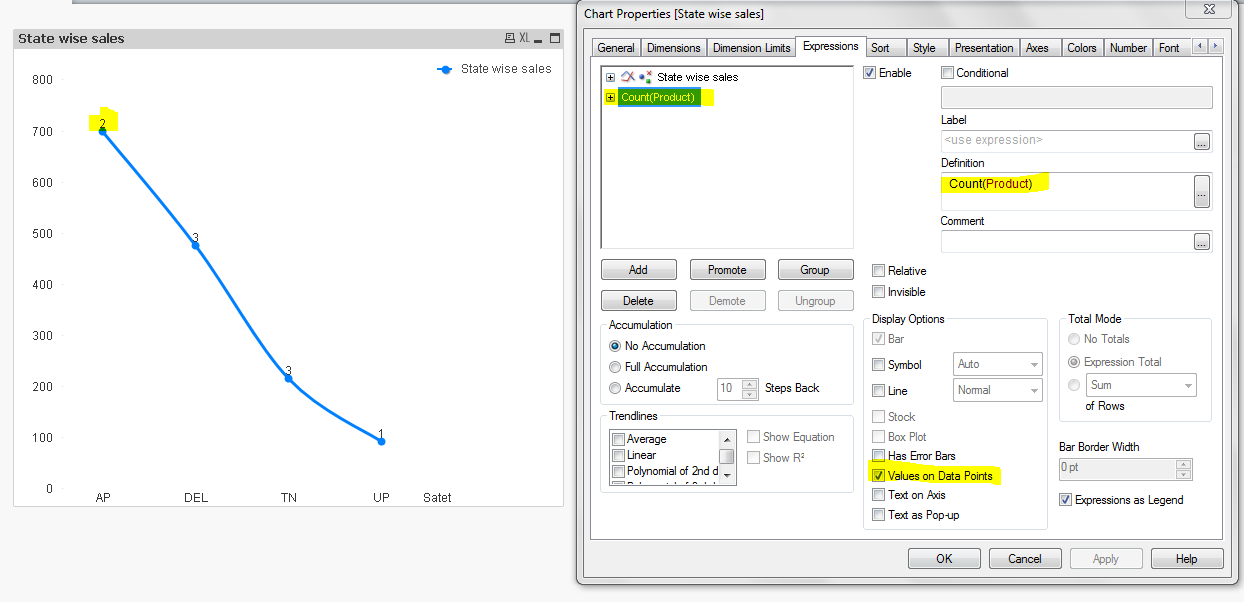
Thanks
- « Previous Replies
-
- 1
- 2
- Next Replies »