Unlock a world of possibilities! Login now and discover the exclusive benefits awaiting you.
- Qlik Community
- :
- All Forums
- :
- QlikView App Dev
- :
- Data Problem
- Subscribe to RSS Feed
- Mark Topic as New
- Mark Topic as Read
- Float this Topic for Current User
- Bookmark
- Subscribe
- Mute
- Printer Friendly Page
- Mark as New
- Bookmark
- Subscribe
- Mute
- Subscribe to RSS Feed
- Permalink
- Report Inappropriate Content
Data Problem
Hi at all,
I have found this issue:
I have two data set: one for revenues and other one for costs, in each one I have the invoice data, payment data.
I would like to create a table with Months on column and for each months I would like to have one row for revenues and other one for costs.
The problem is that i would like to create an input box with the possibility to select or Month coming from Invoice Data or coming from Payment Data.
Example:
Revenue Table
N° Invoice, Invoice Data,Payment Data, Amount
1, 01/01/2017, 01/02/2017, 30
2, 01/02/2017, 01/03/2017, 40
3, 01/03/2017, 20/03/2017, 10
Cost Table
N° Invoice, Invoice Data,Payment Data, Amount
1, 01/01/2017, 01/02/2017, 15
2, 01/02/2017, 01/03/2017, 20
3, 01/03/2017, 20/03/2017, 20
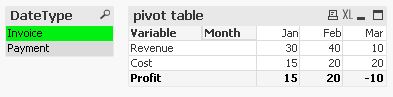
Then if i select Invoice from Input box i would like to have a result like this:
| Variable | Gen | Feb | Mar |
|---|---|---|---|
| Revenue | 30 | 40 | 10 |
| Cost | 15 | 20 | 20 |
| Profit | 15 | 20 | -10 |
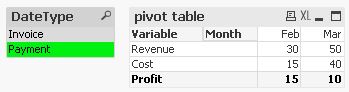
If i select Payment from Input box:
| Variable | Gen | Feb | Mar |
|---|---|---|---|
| Revenue | 0 | 30 | 50 |
| Cost | 0 | 15 | 40 |
| Profit | 0 | 15 | 10 |
Is it possible to do this?
Thank in advance
Andrea
Accepted Solutions
- Mark as New
- Bookmark
- Subscribe
- Mute
- Subscribe to RSS Feed
- Permalink
- Report Inappropriate Content
Hi,
one solution might be:
tabCostRevenue:
LOAD *,
    'Revenue' as Variable,
    RowNo() as ID
INLINE [
    N° Invoice, Invoice Date, Payment Date, Amount
    1, 01/01/2017, 01/02/2017, 30
    2, 01/02/2017, 01/03/2017, 40
    3, 01/03/2017, 20/03/2017, 10
];

LOAD *,
    'Cost' as Variable,
    RowNo() as ID
INLINE [
    N° Invoice, Invoice Date, Payment Date, Amount
    1, 01/01/2017, 01/02/2017, 15
    2, 01/02/2017, 01/03/2017, 20
    3, 01/03/2017, 20/03/2017, 20
];

tabDateLink:
CrossTable (DateTypeTemp, Date)
LOAD ID,
    [Invoice Date],
    [Payment Date]
Resident tabCostRevenue;
Join
LOAD Distinct
    DateTypeTemp,
    SubField(DateTypeTemp,' ',1) as DateType
Resident tabDateLink;

tabCalendar:
LOAD *,
    Day(Date) as Day,
    WeekDay(Date) as WeekDay,
    Week(Date) as Week,
    WeekName(Date) as WeekName,
    Month(Date) as Month,
    MonthName(Date) as MonthName,
    Dual('Q'&Ceil(Month(Date)/3),Ceil(Month(Date)/3)) as Quarter,
    QuarterName(Date) as QuarterName,
    Year(Date) as Year,
    WeekYear(Date) as WeekYear;
LOAD Date(MinDate+IterNo()-1) as Date
While MinDate+IterNo()-1 <= MaxDate;
LOAD Min(Date) as MinDate,
    Max(Date) as MaxDate
Resident tabDateLink;
hope this helps
regards
Marco
- Mark as New
- Bookmark
- Subscribe
- Mute
- Subscribe to RSS Feed
- Permalink
- Report Inappropriate Content
Hi Marco,
Thanks for your help, you gave to me a great idea about how to solve my issue.
I have one more question,
The table for costs and revenues are more complicated than those I've shown you by example.
costs analysis for example use three tables:
1) Supplier Data
2) Product Data
3) Costs Table
The revenues analysis is the same but the columns inside are not equal.
I see that when you load your script the revenues data and costs data create a new table with a variable that indicates if the record is a cost or a revenue.
My question is: Is it possible do the same thing even if the source table (for revenue and costs) are not equal or it is necessary that they have the same columns?
Best Regards
Andrea
- Mark as New
- Bookmark
- Subscribe
- Mute
- Subscribe to RSS Feed
- Permalink
- Report Inappropriate Content
Hi,
this should be possible.
Can you please share some sample lines of each table and your expected result?
thanks
Marco
- Mark as New
- Bookmark
- Subscribe
- Mute
- Subscribe to RSS Feed
- Permalink
- Report Inappropriate Content
Hi Marco, !
Sorry for the delay,
I attached an xlsx file with I tried to insert some example table (three for costs and other three for revenues):
My goal is to upload this tables on a qlik view document and do some visualization like revenue by customers, by area, analyse products purchased, etc etc
But also i would like to create a table or other visualization in which I compare revenue and costs by months (there are three types of data), months could be by invoice data (sales and costs), payment data or competence data.
I tried your previous solution and by the costs everything is ok (even if I am trying to create a calculated field that allows me to compare costs of current months compared with previous month and it is not so easy and i have to try again  )
)
Thanks again for your help
Andrea
- Mark as New
- Bookmark
- Subscribe
- Mute
- Subscribe to RSS Feed
- Permalink
- Report Inappropriate Content
Hi Manuel,
I would like to ask you if you can help me to create a formula, for cost data, that allow me to calc the difference between the amount of current month and amount of previous.
So i would like to create a bar chart with months on X axis and in the tooltip the information about the % difference between the month selected and the previous one.
I tried to create an ID for each month (because i would like to make a comparison even if I select January because i want to compare that amount with the amount of December but previous year)
I called this field Month_ID and now i would like to know if you have some suggestion for it.
Andrea