Unlock a world of possibilities! Login now and discover the exclusive benefits awaiting you.
- Qlik Community
- :
- All Forums
- :
- QlikView App Dev
- :
- Re: Data missing from charts
- Subscribe to RSS Feed
- Mark Topic as New
- Mark Topic as Read
- Float this Topic for Current User
- Bookmark
- Subscribe
- Mute
- Printer Friendly Page
- Mark as New
- Bookmark
- Subscribe
- Mute
- Subscribe to RSS Feed
- Permalink
- Report Inappropriate Content
Data missing from charts
My bar charts are not showing data for all possible dimension values (see examples below).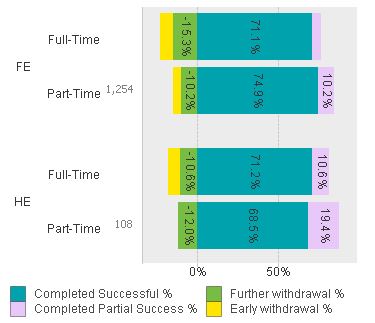
In the chart above the data that is missing is an expression that shows the total number of enrolments displayed as 'text on axis'. It shows the data for all years except the first year (2009-10). I have a similar problem in other similar charts. It looks like it is always the first possible value in the dimension that is missing.
- Tags:
- new_to_qlikview
- Mark as New
- Bookmark
- Subscribe
- Mute
- Subscribe to RSS Feed
- Permalink
- Report Inappropriate Content
Hi Greg,
Kindly check if you made any selections on Year field or any restrictions in presentation tab
-Jay
- Mark as New
- Bookmark
- Subscribe
- Mute
- Subscribe to RSS Feed
- Permalink
- Report Inappropriate Content
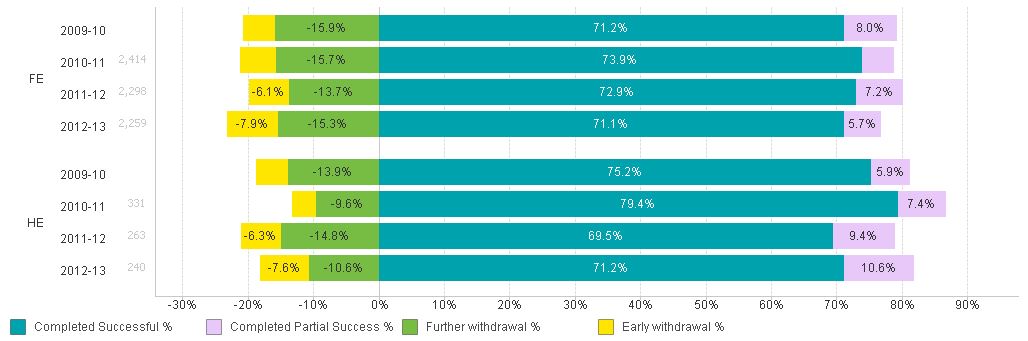
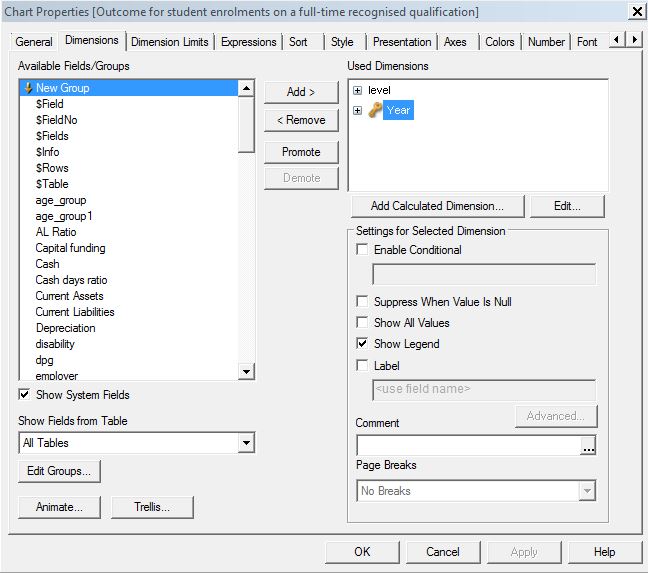
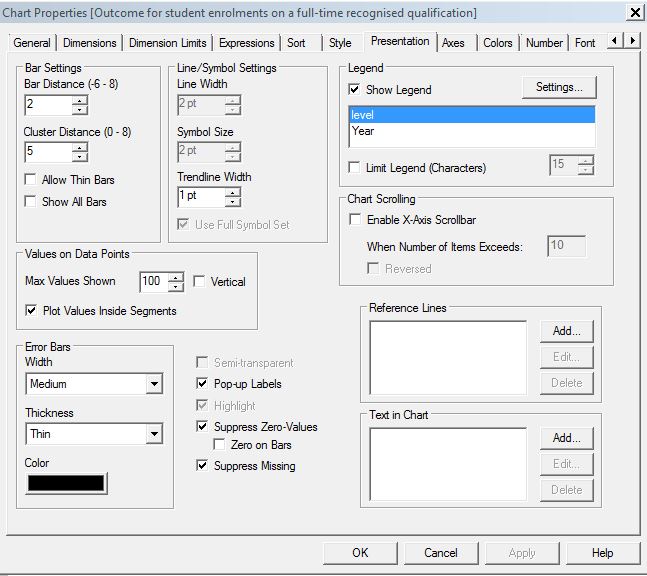
Thanks Jay. I don't think I have made any conditions on the Year field or any restrictions in the presentation tab. See images below.
- Mark as New
- Bookmark
- Subscribe
- Mute
- Subscribe to RSS Feed
- Permalink
- Report Inappropriate Content
Hi Greg,
I've just tested this on my own app and I can see the same behaviour (though my missing number is actually just misplaced on top of another element). I suspect this is a bug related to the use of two dimensions and placing text on the axis so it probably needs raising with the Qlik Support team (support@qlik.com). Do you have a support contract or would you like me to raise this for you (probably best if you can own it to keep visibility).
- Mark as New
- Bookmark
- Subscribe
- Mute
- Subscribe to RSS Feed
- Permalink
- Report Inappropriate Content
Hi,
Plz check the limitations if u made in presentation tab like static min and static max
- Mark as New
- Bookmark
- Subscribe
- Mute
- Subscribe to RSS Feed
- Permalink
- Report Inappropriate Content
Thanks Adam. Good to know its not just me. I'll log this with my IT partner who will take this up with Qlikview Support. Might be helpful if you logged it too, so they can see its not just me.
Cheers
Greg
- Mark as New
- Bookmark
- Subscribe
- Mute
- Subscribe to RSS Feed
- Permalink
- Report Inappropriate Content
Thanks Rakesh. I haven't set any static min or static max values.
We think this may be a Qlikview bug related to the use of two dimensions and the placing of text on the axis.