Unlock a world of possibilities! Login now and discover the exclusive benefits awaiting you.
- Qlik Community
- :
- All Forums
- :
- QlikView App Dev
- :
- Data model query
- Subscribe to RSS Feed
- Mark Topic as New
- Mark Topic as Read
- Float this Topic for Current User
- Bookmark
- Subscribe
- Mute
- Printer Friendly Page
- Mark as New
- Bookmark
- Subscribe
- Mute
- Subscribe to RSS Feed
- Permalink
- Report Inappropriate Content
Data model query
Hi Experts,
Below case need your help. I have attached the Qvf and source file we used.
Now we want to achieve below,
when select MAT the value should be all the years sales based on Year deimension;
when select Monthly the value should be the sales in the past two years based on YearMonth dimension.
When select Qtr the value should be sales in the past years based on YearQtr dimension;
When select YTD the value should be sales in the Past-3/Past-6/YTD sales based on GrowthTrending dimension.
so we used pick/match to achieve.
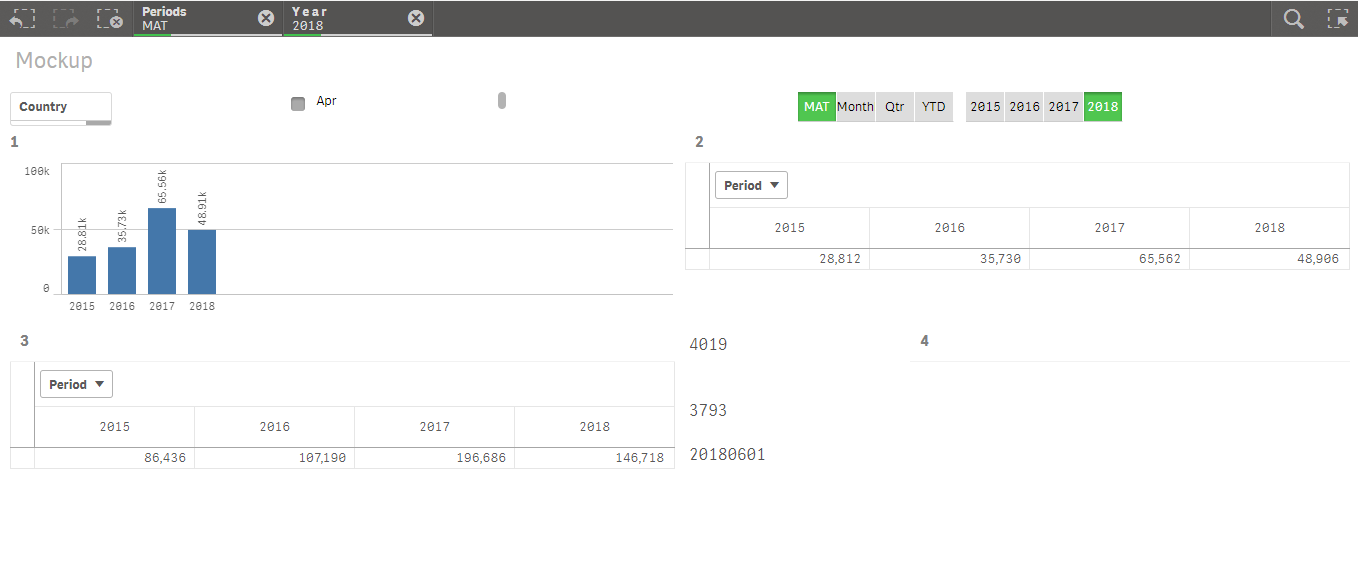
For below screenshot,
For part1 chart can get the correct num, but we used same logic for part3 pivot table, then for MAT/QTR/Monthly the num is three times than chart correct num, and also for YTD, many times than correct num;
So my first concern is that why bar chart can get the correct num, but for pivot table, we cant get it. we used the same dimension and measure.
Please help to check. Thanks in advance!!
Best Regards,
Haifeng