Unlock a world of possibilities! Login now and discover the exclusive benefits awaiting you.
- Qlik Community
- :
- All Forums
- :
- QlikView App Dev
- :
- Re: Debtors ageing buckets with one dimension
- Subscribe to RSS Feed
- Mark Topic as New
- Mark Topic as Read
- Float this Topic for Current User
- Bookmark
- Subscribe
- Mute
- Printer Friendly Page
- Mark as New
- Bookmark
- Subscribe
- Mute
- Subscribe to RSS Feed
- Permalink
- Report Inappropriate Content
Debtors ageing buckets with one dimension
I have a pivot table with one dimension (Fiscal Month) and 3 expressions (Sum (AGE1AMT), Sum (AGE2AMT), Sum (AGE3AMT) ). I need the total of for each fiscal month at the bottom.
| AB_Fiscal_Year | Apr-16 | May-16 | Jun-16 | Total |
| 14 to 28 Days | 200 | 350 | 300 | 850 |
| <=14 Days | 500 | 450 | 200 | 1,150 |
| Over 28 Days | 100 | 50 | 350 | 500 |
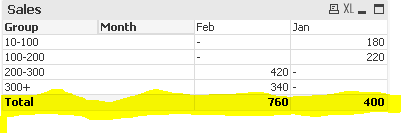
In the presentation tab when I select Show Partial Sum with Subtotals at the bottom this is what I get. I need the totals at the bottom of each month. AGE1AMT is <=14 Days, AGE2AMT is 14 - 28 Days,AGE3AMT is Over 28 Days,
ApplyMap('Fiscal_Label_MAP', AB_Fiscal_Year) as AB_Fiscal_Year,
AB_AR_Net_Bal,
If (AB_AR_Net_Bal >= CUM_AGE1AMT, CUM_AGE1AMT, AB_AR_Net_Bal) as AGE1AMT,
If ( (AB_AR_Net_Bal - CUM_AGE1AMT) > 0 and (AB_AR_Net_Bal - CUM_AGE1AMT) > CUM_AGE2AMT, CUM_AGE2AMT,
if (AB_AR_Net_Bal <= CUM_AGE1AMT, 0, AB_AR_Net_Bal - CUM_AGE1AMT ))
as AGE2AMT,
If (AB_AR_Net_Bal > (CUM_AGE1AMT + CUM_AGE2AMT), AB_AR_Net_Bal - (CUM_AGE1AMT + CUM_AGE2AMT) ) as AGE3AMT
Resident Age_Buckets_1;
- Mark as New
- Bookmark
- Subscribe
- Mute
- Subscribe to RSS Feed
- Permalink
- Report Inappropriate Content
At presentation tab Apply show partial sum on Bucket. Refer thus sample
- Mark as New
- Bookmark
- Subscribe
- Mute
- Subscribe to RSS Feed
- Permalink
- Report Inappropriate Content
HI
TABLE:
crosstable(MONTH,VALUE)
load * inline [
AB_Fiscal_Year, Apr-16, May-16, Jun-16
14 to 28 Days, 200, 300, 500
<=14 Days, 300, 400, 600
Over 28 Days, 700, 800, 200
]
Take dimention as MONTH and expression like this
sum({<AB_Fiscal_Year={'<=14 Days'}>}value)
sum({<AB_Fiscal_Year={'14 to 28 Days'}>}value)
sum({<AB_Fiscal_Year={'Over 28 Days'}>}value)
- Mark as New
- Bookmark
- Subscribe
- Mute
- Subscribe to RSS Feed
- Permalink
- Report Inappropriate Content
Hi Mani,
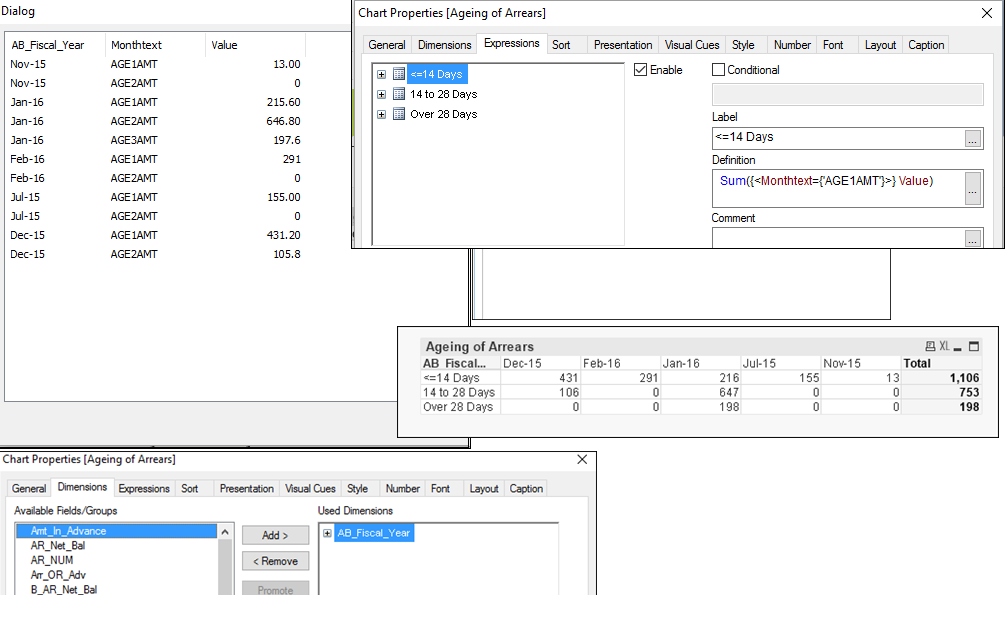
Still the Total for the month appear on the right side, not at the bottom.
Age_Buckets_2:
LOAD
AB_ARNUM,
ApplyMap('Fiscal_Label_MAP', AB_Fiscal_Year) as AB_Fiscal_Year,
AB_Sort_Month,
AB_AR_Net_Bal,
CUM_AGE1AMT,
CUM_AGE2AMT,
If (AB_AR_Net_Bal >= CUM_AGE1AMT, CUM_AGE1AMT, AB_AR_Net_Bal) as AGE1AMT,
If ( (AB_AR_Net_Bal - CUM_AGE1AMT) > 0 and (AB_AR_Net_Bal - CUM_AGE1AMT) > CUM_AGE2AMT, CUM_AGE2AMT,
if (AB_AR_Net_Bal <= CUM_AGE1AMT, 0, AB_AR_Net_Bal - CUM_AGE1AMT ))
as AGE2AMT,
If (AB_AR_Net_Bal > (CUM_AGE1AMT + CUM_AGE2AMT), AB_AR_Net_Bal - (CUM_AGE1AMT + CUM_AGE2AMT) ) as AGE3AMT
Resident Age_Buckets_1;
Age_Buckets_3:
CrossTable (Monthtext,Value)
LOAD
AB_Fiscal_Year,
AGE1AMT,
AGE2AMT,
AGE3AMT
Resident Age_Buckets_2
- Mark as New
- Bookmark
- Subscribe
- Mute
- Subscribe to RSS Feed
- Permalink
- Report Inappropriate Content
Applying Partial Sum puts the total at the right side. I need it at the bottom. See below my reply.
- Mark as New
- Bookmark
- Subscribe
- Mute
- Subscribe to RSS Feed
- Permalink
- Report Inappropriate Content
Hi,
Can you please attache you qvw file.
or
Use Pivot table .
Drag the Dimension column to right side as a columns. and drag expression to down side as a records. you will get output this like.
AB_Fiscal_Year 14 to 28 Days <=14 Days Over 28 Days
Apr-16 200 300 500
May-16 300 400 600
Jun-16 700 800 200
total 1200 1500 1300
- Mark as New
- Bookmark
- Subscribe
- Mute
- Subscribe to RSS Feed
- Permalink
- Report Inappropriate Content
Like this...