Unlock a world of possibilities! Login now and discover the exclusive benefits awaiting you.
- Qlik Community
- :
- All Forums
- :
- QlikView App Dev
- :
- Derive month column from data
- Subscribe to RSS Feed
- Mark Topic as New
- Mark Topic as Read
- Float this Topic for Current User
- Bookmark
- Subscribe
- Mute
- Printer Friendly Page
- Mark as New
- Bookmark
- Subscribe
- Mute
- Subscribe to RSS Feed
- Permalink
- Report Inappropriate Content
Derive month column from data
Hi All,
I have excel data with month wise demand and actual hours as separate columns , however i need to have bar chart with Month wise details of demand and actual hours, please suggest how to derive month column with below.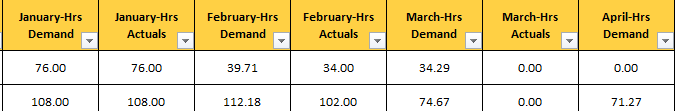
Accepted Solutions
- Mark as New
- Bookmark
- Subscribe
- Mute
- Subscribe to RSS Feed
- Permalink
- Report Inappropriate Content
Hi,
as described above, you can use CROSSTABLE to transform your columns to line
but i don't know why CROSSTABLE don't work here when because there is no qualifier column before your first column.
so I added a first column on the table you gave me, called dimension1, with 1 as value:
and try this:
cross:
CrossTable(dimension2, Data)
LOAD dimension1,
[January-Hrs Demand] as 1,
[January-Hrs Actuals] as 1,
[February-Hrs Demand] as 2,
[February-Hrs Actuals] as 2,
[March-Hrs Demand] as 3,
[March-Hrs Actuals] as 3,
[April-Hrs Demand] as 4,
[April-Hrs Actuals] as 4,
[May-Hrs Demand] as 5,
[May-Hrs Actuals] as 5,
[June-Hrs Demand] as 6,
[June-Hrs Actuals] as 6,
[July-Hrs Demand] as 7,
[July-Hrs Actuals] as 7,
[August-Hrs Demand] as 8,
[August-Hrs Actuals] as 8,
[September-Hrs Demand] as 9,
[September-Hrs Actuals] as 9,
[October-Hrs Demand] as 10,
[October-Hrs Actuals] as 10,
[November-Hrs Demand] as 11,
[November-Hrs Actuals] as 11,
[December-Hrs Demand] as 12,
[December-Hrs Actuals] as 12
FROM
(ooxml, embedded labels, table is Feuil1);
cross2:
LOAD dimension1,date(Date#(dimension2,'M'),'M') as Month, Data
Resident cross;
DROP Field dimension1 From cross2;
DROP Table cross;
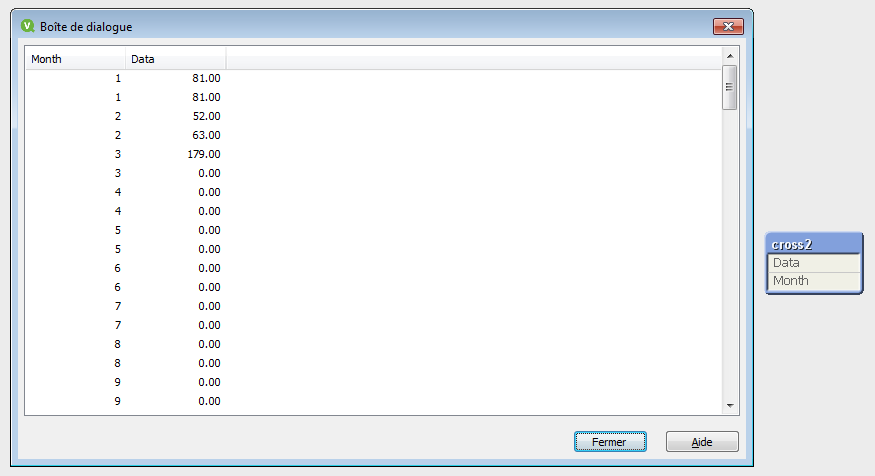
you data will be like this:
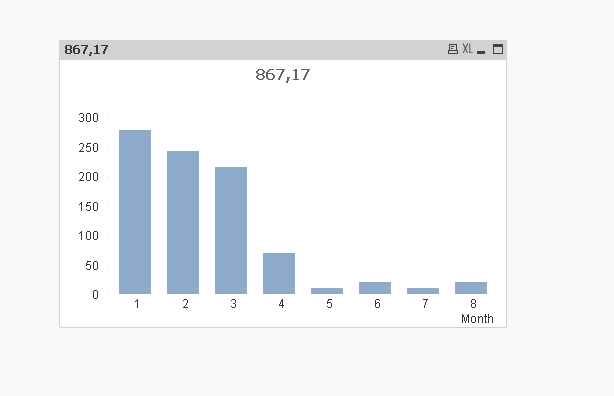
and your barchart like this:
- Mark as New
- Bookmark
- Subscribe
- Mute
- Subscribe to RSS Feed
- Permalink
- Report Inappropriate Content
Hi,
can you attach some rows of your data (in the same structure) on excel for example ?
you will have to use CROSSTABLE when you load your table
- Mark as New
- Bookmark
- Subscribe
- Mute
- Subscribe to RSS Feed
- Permalink
- Report Inappropriate Content
in values you have only for hours right?
try with subfield function to get month and hour as seperate columns
SubField(Field, '-',1) as month,
- Mark as New
- Bookmark
- Subscribe
- Mute
- Subscribe to RSS Feed
- Permalink
- Report Inappropriate Content
Hi,
Please find below, could you please assist how to do the cross tab , im unable to get my output
| January-Hrs Demand | January-Hrs Actuals | February-Hrs Demand | February-Hrs Actuals | March-Hrs Demand | March-Hrs Actuals | April-Hrs Demand | April-Hrs Actuals | May-Hrs Demand | May-Hrs Actuals | June-Hrs Demand | June-Hrs Actuals | July-Hrs Demand | July-Hrs Actuals | August-Hrs Demand | August-Hrs Actuals | September-Hrs Demand | September-Hrs Actuals | October-Hrs Demand | October-Hrs Actuals | November-Hrs Demand | November-Hrs Actuals | December-Hrs Demand | December-Hrs Actuals |
| 81.00 | 81.00 | 52.00 | 63.00 | 179.00 | 0.00 | 0.00 | 0.00 | 0.00 | 0.00 | 0.00 | 0.00 | 0.00 | 0.00 | 0.00 | 0.00 | 0.00 | 0.00 | 0.00 | 0.00 | 0.00 | 0.00 | 0.00 | 0.00 |
| 0.00 | 0.00 | 10.67 | 6.50 | 20.00 | 0.00 | 20.00 | 0.00 | 10.00 | 0.00 | 20.00 | 0.00 | 10.00 | 0.00 | 20.00 | 0.00 | 0.00 | 0.00 | 0.00 | 0.00 | 0.00 | 0.00 | 0.00 | 0.00 |
| 0.00 | 59.00 | 0.00 | 37.00 | 0.00 | 0.00 | 0.00 | 0.00 | 0.00 | 0.00 | 0.00 | 0.00 | 0.00 | 0.00 | 0.00 | 0.00 | 0.00 | 0.00 | 0.00 | 0.00 | 0.00 | 0.00 | 0.00 | 0.00 |
| 10.00 | 10.00 | 25.44 | 12.00 | 8.56 | 0.00 | 30.00 | 0.00 | 0.00 | 0.00 | 0.00 | 0.00 | 0.00 | 0.00 | 0.00 | 0.00 | 0.00 | 0.00 | 0.00 | 0.00 | 0.00 | 0.00 | 0.00 | 0.00 |
| 13.00 | 9.00 | 17.39 | 15.00 | 7.61 | 0.00 | 20.00 | 0.00 | 0.00 | 0.00 | 0.00 | 0.00 | 0.00 | 0.00 | 0.00 | 0.00 | 0.00 | 0.00 | 0.00 | 0.00 | 0.00 | 0.00 | 0.00 | 0.00 |
| 8.00 | 8.00 | 2.00 | 2.00 | 0.00 | 0.00 | 0.00 | 0.00 | 0.00 | 0.00 | 0.00 | 0.00 | 0.00 | 0.00 | 0.00 | 0.00 | 0.00 | 0.00 | 0.00 | 0.00 | 0.00 | 0.00 | 0.00 | 0.00 |
- Mark as New
- Bookmark
- Subscribe
- Mute
- Subscribe to RSS Feed
- Permalink
- Report Inappropriate Content
what is the exact requirement? from hours i dont think so you will get month?
- Mark as New
- Bookmark
- Subscribe
- Mute
- Subscribe to RSS Feed
- Permalink
- Report Inappropriate Content
Hi,
Need Month column from above with values as Jan,Feb ....Dec to show them in Barchart as dimension with two bars as Demand hours and Actual hours.
- Mark as New
- Bookmark
- Subscribe
- Mute
- Subscribe to RSS Feed
- Permalink
- Report Inappropriate Content
Okay . But if there is no related values for month in your data right?
in general we cant get month from Hours field AFAIk.
Yousuf have some idea let see.
- Mark as New
- Bookmark
- Subscribe
- Mute
- Subscribe to RSS Feed
- Permalink
- Report Inappropriate Content
Hi,
as described above, you can use CROSSTABLE to transform your columns to line
but i don't know why CROSSTABLE don't work here when because there is no qualifier column before your first column.
so I added a first column on the table you gave me, called dimension1, with 1 as value:
and try this:
cross:
CrossTable(dimension2, Data)
LOAD dimension1,
[January-Hrs Demand] as 1,
[January-Hrs Actuals] as 1,
[February-Hrs Demand] as 2,
[February-Hrs Actuals] as 2,
[March-Hrs Demand] as 3,
[March-Hrs Actuals] as 3,
[April-Hrs Demand] as 4,
[April-Hrs Actuals] as 4,
[May-Hrs Demand] as 5,
[May-Hrs Actuals] as 5,
[June-Hrs Demand] as 6,
[June-Hrs Actuals] as 6,
[July-Hrs Demand] as 7,
[July-Hrs Actuals] as 7,
[August-Hrs Demand] as 8,
[August-Hrs Actuals] as 8,
[September-Hrs Demand] as 9,
[September-Hrs Actuals] as 9,
[October-Hrs Demand] as 10,
[October-Hrs Actuals] as 10,
[November-Hrs Demand] as 11,
[November-Hrs Actuals] as 11,
[December-Hrs Demand] as 12,
[December-Hrs Actuals] as 12
FROM
(ooxml, embedded labels, table is Feuil1);
cross2:
LOAD dimension1,date(Date#(dimension2,'M'),'M') as Month, Data
Resident cross;
DROP Field dimension1 From cross2;
DROP Table cross;
you data will be like this:
and your barchart like this:
- Mark as New
- Bookmark
- Subscribe
- Mute
- Subscribe to RSS Feed
- Permalink
- Report Inappropriate Content
Thank you so much, its working as you suggested
- Mark as New
- Bookmark
- Subscribe
- Mute
- Subscribe to RSS Feed
- Permalink
- Report Inappropriate Content
you're welcome!
Good luck