Unlock a world of possibilities! Login now and discover the exclusive benefits awaiting you.
- Qlik Community
- :
- All Forums
- :
- QlikView App Dev
- :
- Different year value in a single bar with differen...
- Subscribe to RSS Feed
- Mark Topic as New
- Mark Topic as Read
- Float this Topic for Current User
- Bookmark
- Subscribe
- Mute
- Printer Friendly Page
- Mark as New
- Bookmark
- Subscribe
- Mute
- Subscribe to RSS Feed
- Permalink
- Report Inappropriate Content
Different year value in a single bar with different color
hello everyone,
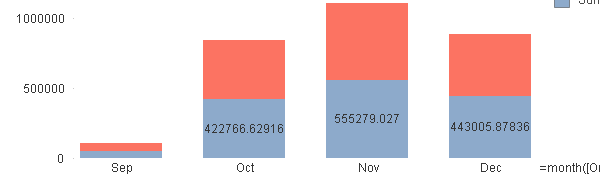
i have below chart, which is contain monthly sale
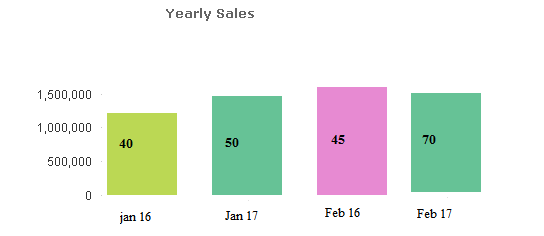
but i want show like below,means in a single bar it will show only jan's 16 and 17 sales(no need to show year in chart) data with two different color how it will be possible?
Thank You.
- « Previous Replies
- Next Replies »
- Mark as New
- Bookmark
- Subscribe
- Mute
- Subscribe to RSS Feed
- Permalink
- Report Inappropriate Content
That's not possible. Are you expecting 2016 and 2017 same as in your Image?
- Mark as New
- Bookmark
- Subscribe
- Mute
- Subscribe to RSS Feed
- Permalink
- Report Inappropriate Content
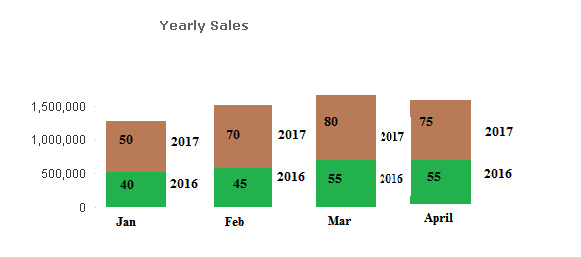
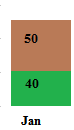
I am expecting like below
- Mark as New
- Bookmark
- Subscribe
- Mute
- Subscribe to RSS Feed
- Permalink
- Report Inappropriate Content
Looks like achievable.
Create Bar chart and
Dimension is
Month(FieldName)
Expression
Sum({<Year = {'2017'}>} Sales)
Sum({<Year = {'2016'}>} Sales)
And setting should change like in style tab you need to change from Group to Static.
- Mark as New
- Bookmark
- Subscribe
- Mute
- Subscribe to RSS Feed
- Permalink
- Report Inappropriate Content
Try like:
Dim1: Month
Dim2: Year
Exp: <your exp>
Bar chart->Style tab->Subtype 'Stacked'
- Mark as New
- Bookmark
- Subscribe
- Mute
- Subscribe to RSS Feed
- Permalink
- Report Inappropriate Content
Try this:
Use staked chart option.
Br,
KC
KC
- Mark as New
- Bookmark
- Subscribe
- Mute
- Subscribe to RSS Feed
- Permalink
- Report Inappropriate Content
Hi,
may be this?
- Mark as New
- Bookmark
- Subscribe
- Mute
- Subscribe to RSS Feed
- Permalink
- Report Inappropriate Content
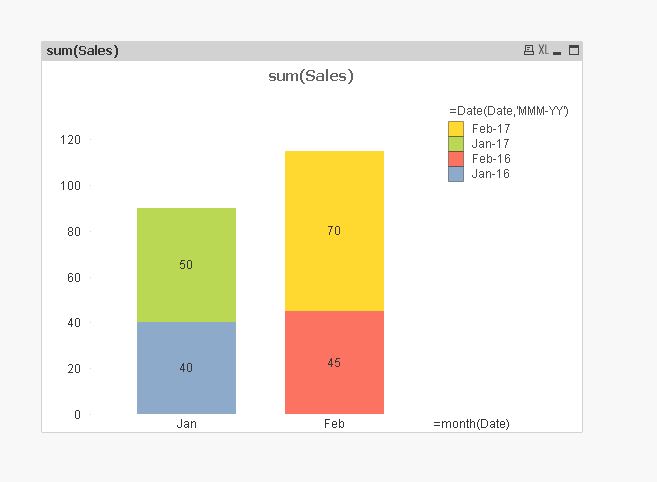
it show like this
- Mark as New
- Bookmark
- Subscribe
- Mute
- Subscribe to RSS Feed
- Permalink
- Report Inappropriate Content
i am not able to read QVW file, please share a screenshot
- Mark as New
- Bookmark
- Subscribe
- Mute
- Subscribe to RSS Feed
- Permalink
- Report Inappropriate Content
Yes, You need to plot the inside the data points and disable the option called "Show the total on Top" in the presentation tab.
- « Previous Replies
- Next Replies »