Unlock a world of possibilities! Login now and discover the exclusive benefits awaiting you.
- Qlik Community
- :
- All Forums
- :
- QlikView App Dev
- :
- Dimension Limits
- Subscribe to RSS Feed
- Mark Topic as New
- Mark Topic as Read
- Float this Topic for Current User
- Bookmark
- Subscribe
- Mute
- Printer Friendly Page
- Mark as New
- Bookmark
- Subscribe
- Mute
- Subscribe to RSS Feed
- Permalink
- Report Inappropriate Content
Dimension Limits
Hi,
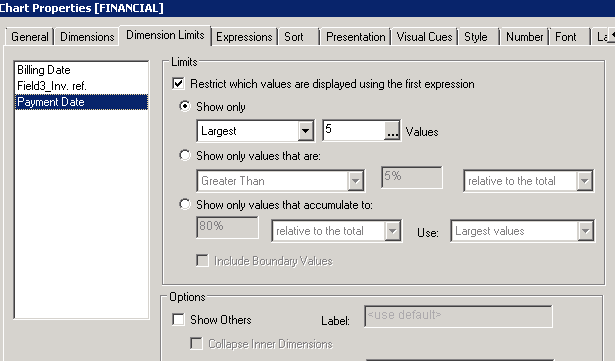
I want to limit the data shown in my straight table based on largest 5 values(expression is no. of days)
I have to show it in descending order, +ve days, then the -ve days(amount going highest to lowest).
So, after setting the dimension limit to largest 5, my table should have shown the data till the yellow line.
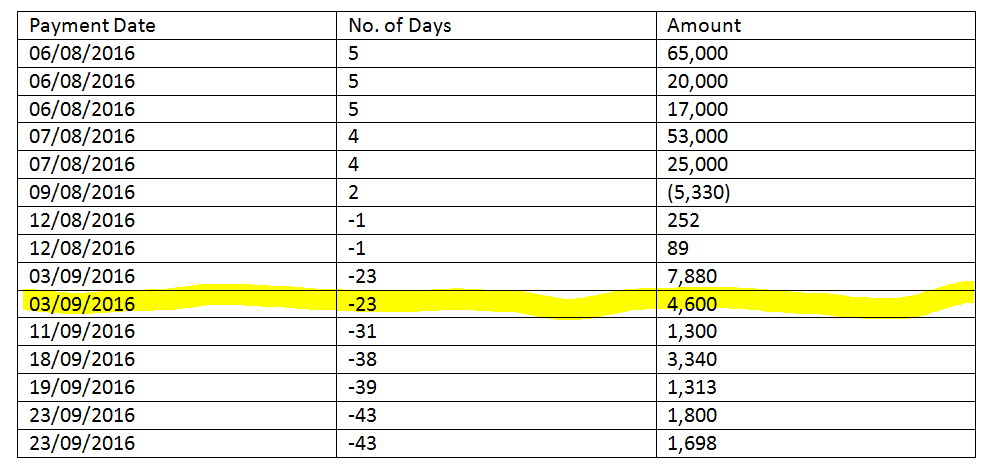
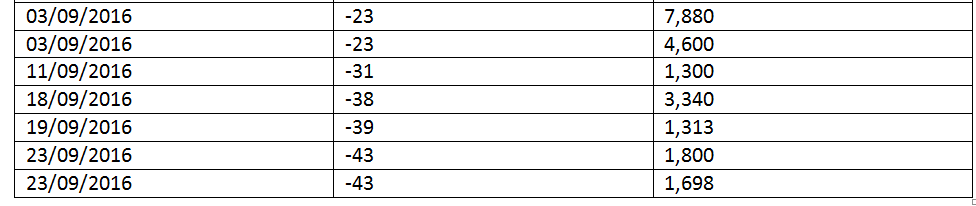
However, it's instead showing me something like this, basically ignoring the minus(-) sign.
How can I get it to work the way I want? Please help.
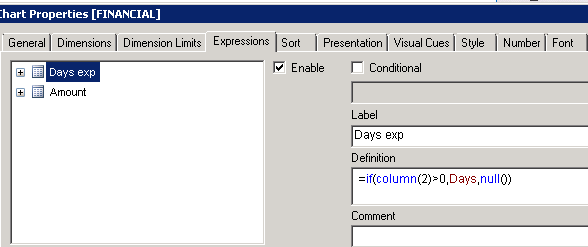
Note: The value for Days is calculated in the script .
Interval(Date#(Today(),'MM/DD/YYYY')-Date#([Field9_Pmnt date],'MM/DD/YYYY'),'DD') as Days
The purpose is basically to limit the rows on the basis of 'Days'. Since you cannot limit the rows based on a dimension, I had to add the 'Days' as an expression.
Accepted Solutions
- Mark as New
- Bookmark
- Subscribe
- Mute
- Subscribe to RSS Feed
- Permalink
- Report Inappropriate Content
- Mark as New
- Bookmark
- Subscribe
- Mute
- Subscribe to RSS Feed
- Permalink
- Report Inappropriate Content
Would you be able to share a sample to take a look at
- Mark as New
- Bookmark
- Subscribe
- Mute
- Subscribe to RSS Feed
- Permalink
- Report Inappropriate Content
Hi Sunny,
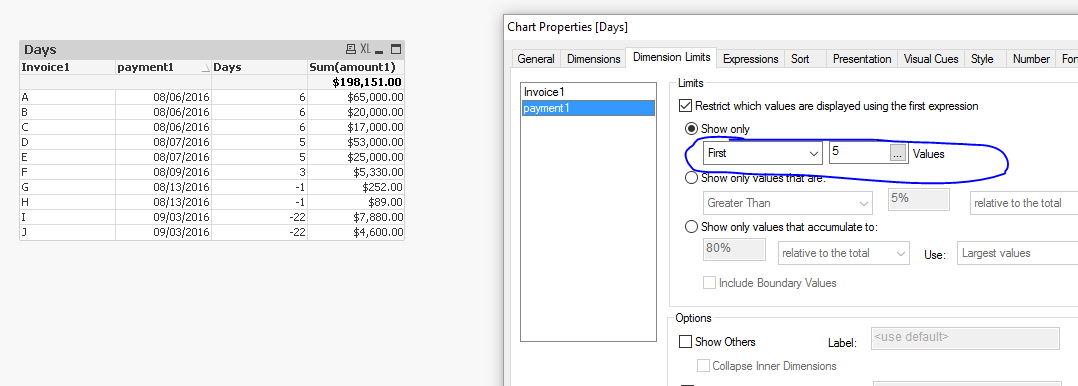
I have attached a sample file. The chart is limited to largest 5 values. You can see how's it's ignoring the negative sign and showing the negative values as the largest.
- Mark as New
- Bookmark
- Subscribe
- Mute
- Subscribe to RSS Feed
- Permalink
- Report Inappropriate Content
How about using first 5, instead of largest 5?
- Mark as New
- Bookmark
- Subscribe
- Mute
- Subscribe to RSS Feed
- Permalink
- Report Inappropriate Content
Here is another option, filtering your dimension using set analysis in the dimension or all expression aggregations.
Should still work when sorting the columns.
- Mark as New
- Bookmark
- Subscribe
- Mute
- Subscribe to RSS Feed
- Permalink
- Report Inappropriate Content
Hi Stefan
can yopu please help me out
Top two values in current month comparing the same values with previous month