Unlock a world of possibilities! Login now and discover the exclusive benefits awaiting you.
- Qlik Community
- :
- All Forums
- :
- QlikView App Dev
- :
- Re: Dimension Selection
- Subscribe to RSS Feed
- Mark Topic as New
- Mark Topic as Read
- Float this Topic for Current User
- Bookmark
- Subscribe
- Mute
- Printer Friendly Page
- Mark as New
- Bookmark
- Subscribe
- Mute
- Subscribe to RSS Feed
- Permalink
- Report Inappropriate Content
Dimension Selection
Hello,
I have a data model with bunch of tables. One of them has the sample information:
ItemNo Date Handler Amount
1 2014-12-31 AA 200
1 2015-01-31 BB 100
1 2015-02-28 CC 100
2 2014-12-31 EE 200
2 2015-01-31 DD 100
.
.
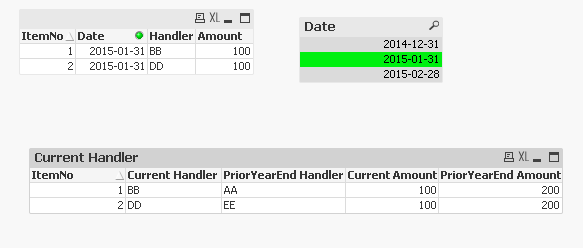
The front end application is based on the user selecting the date and relevant charts showing information as of that date. For example, if user wanted to know Handler information and Amount on 2015-01-31 for all ItemNo, they would select the date and know handler to be BB for ItemNo1 with amount of 100 and DD for ItemNo2 with amount of 100 and so on.
However, given the selection is made, is there some way to show who the Handler was prior year end. So given selection of 2015-01-31, I want to show something like this in a chart for all ItemNo:
ItemNo Current Handler PriorYearEnd Handler CurrentAmount PriorYearEndAmount
1 BB AA 100 200
2 DD EE 100 200
I know how to use set analysis to get the amount for prior year end but not sure how to get the dimension(Handler) value at prior year end.
Appreciate any help!
Accepted Solutions
- Mark as New
- Bookmark
- Subscribe
- Mute
- Subscribe to RSS Feed
- Permalink
- Report Inappropriate Content
- Mark as New
- Bookmark
- Subscribe
- Mute
- Subscribe to RSS Feed
- Permalink
- Report Inappropriate Content
See attached example.
talk is cheap, supply exceeds demand
- Mark as New
- Bookmark
- Subscribe
- Mute
- Subscribe to RSS Feed
- Permalink
- Report Inappropriate Content
Check out the attached
Dimension: ItemNo
Expressions
1) =Handler
2) =Only({<Date>}Aggr(If(Max({<Date = {"$(='<' & Date(Max(Date)))"}>}TOTAL <ItemNo> Date) = Only({<Date>} Date), Only({<Date>}Handler)), ItemNo, Date))
3) Amount
4) =Only({<Date>}Aggr(If(Max({<Date = {"$(='<' & Date(Max(Date)))"}>}TOTAL <ItemNo> Date) = Only({<Date>} Date), Only({<Date>}Amount)), ItemNo, Date))
UPDATE: Now the question is what do you want to see when nothing is selected?
- Mark as New
- Bookmark
- Subscribe
- Mute
- Subscribe to RSS Feed
- Permalink
- Report Inappropriate Content
Thanks! This does help. I didn't know much about the Only function until now.
However, I must admit, for a newbie like me, I didn't understand all of the arguments in Expression 2). So to play around with it, I did something like this:
only({<Date = {'$(yearenddate)'}>} TOTAL <ItemNo> Handler)
where yearenddate is a variable that calculates the prior year end date based on the user's selection of the date. This seems to do the trick, but if I can bother you to 'translate' the arguments in your expression 2, that would be even more helpful.
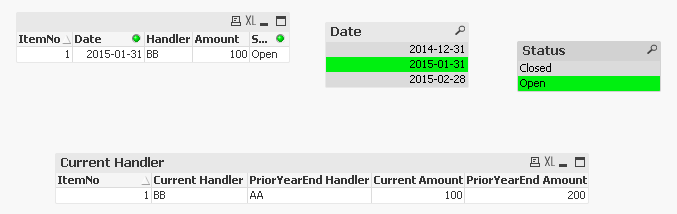
Another question, that I would like to add: If in addition to Handler, I have a dimension called Status (Open/Close), and I wanted to filter the chart to show only Status of Open at prior year end, how would I go about doing this?
So the data would be something like this:
ItemNo Date Handler Amount Status
1 2014-12-31 AA 200 Open
1 2015-01-31 BB 100 Open
1 2015-02-28 CC 100 Closed
2 2014-12-31 EE 200 Closed
2 2015-01-31 DD 100 Closed
So based on this data, and selection of 2015-01-31, the chart should only show ItemNo 1 since at the prior year end, it was Open whereas ItemNo2 was closed.
As for your question, all my charts show condition only if getselectedcount(Date) = 1, so if the user does not select any date, no data is displayed, I have a text box, that will tell the user to select a date.
- Mark as New
- Bookmark
- Subscribe
- Mute
- Subscribe to RSS Feed
- Permalink
- Report Inappropriate Content
but if I can bother you to 'translate' the arguments in your expression 2, that would be even more helpful.
Not sure what are you asking me to translate? Can you please elaborate on what you want?
Another question, that I would like to add: If in addition to Handler, I have a dimension called Status (Open/Close), and I wanted to filter the chart to show only Status of Open at prior year end, how would I go about doing this?
So the data would be something like this:
ItemNo Date Handler Amount Status
1 2014-12-31 AA 200 Open
1 2015-01-31 BB 100 Open
1 2015-02-28 CC 100 Closed
2 2014-12-31 EE 200 Closed
2 2015-01-31 DD 100 Closed
So based on this data, and selection of 2015-01-31, the chart should only show ItemNo 1 since at the prior year end, it was Open whereas ItemNo2 was closed.
Introduction of new selection seems to be working very well with the existing data.
- Mark as New
- Bookmark
- Subscribe
- Mute
- Subscribe to RSS Feed
- Permalink
- Report Inappropriate Content
What I meant by translate, was if you can break down the syntax? Like what does it mean when we write:
Only({<Date>}
Aggr(If(Max({<Date = {"$(='<' & Date(Max(Date)))"}>}TOTAL <ItemNo> Date)
and so on...
With regards to status:
This will not work, if user selects 2015-02-28 as the status for that selection is Closed, and Open will be greyed out. But I want to show ItemNo1 as its status was Open at prior year end.
I tried putting something like
if(Status = 'Open', ItemNo) on the Dimension side, but this will not help in case I want to do YTD calculation, as doing this will omit the row for
1 2015-02-28 CC 100 Closed
in the chart, making the computation of YTD given a selection of that date, incorrect.
Thanks again for all your help!