Unlock a world of possibilities! Login now and discover the exclusive benefits awaiting you.
- Qlik Community
- :
- All Forums
- :
- QlikView App Dev
- :
- Re: Re: Re: Dimension , as a result of sum others ...
- Subscribe to RSS Feed
- Mark Topic as New
- Mark Topic as Read
- Float this Topic for Current User
- Bookmark
- Subscribe
- Mute
- Printer Friendly Page
- Mark as New
- Bookmark
- Subscribe
- Mute
- Subscribe to RSS Feed
- Permalink
- Report Inappropriate Content
Dimension , as a result of sum others dimensions
Hi , i would like to know what is the best way to achieve this
i attached an image to show what i want in qlikview,
what do you suggest? have any idea or example? what technique i have to use?
see the attached
thank you a lot
Fernando
Accepted Solutions
- Mark as New
- Bookmark
- Subscribe
- Mute
- Subscribe to RSS Feed
- Permalink
- Report Inappropriate Content
In this you can use the pivot table also but you have to write 6 expressions
LOAD Nivel1,
//Total,
Total as TotalValue
FROM
[Book1.xlsx]
(ooxml, embedded labels, table is Sheet1);
=Sum( {<Nivel1 = {'Administrativo'}> } TotalValue)
=Sum( {<Nivel1 = {'Comercial'}> } TotalValue)
=Sum( {<Nivel1 = {'Finanzas'}> } TotalValue)
=Sum( {<Nivel1 = {'Sueldos'}> } TotalValue)
=Sum( {<Nivel1 = {'Licencias'}> } TotalValue)
=Column(1)+Column(2)+Column(3)+Column(4)+Column(5) //NET SALES
- Mark as New
- Bookmark
- Subscribe
- Mute
- Subscribe to RSS Feed
- Permalink
- Report Inappropriate Content
Could it be just a total line (set option 'Totals on last row' and proper label on presentation tab)?
Or maybe each line an expression with straight table chart set to 'horizontal'?
Or something else depending on your data model, data and expressions behind?
If above doesn't really help you, I think it would be easier if you could post a small sample that shows data close to your data model and a chart matching your current one.
- Mark as New
- Bookmark
- Subscribe
- Mute
- Subscribe to RSS Feed
- Permalink
- Report Inappropriate Content
Hi Fernando,
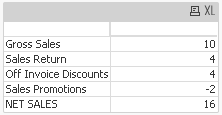
By the use of the Pivot table you can create this type of the charts and use only expressions in the chart do not use the dimensions in the chart. Use your expression what ever it is i explain this with a example here.
Exper1:- Sum([Gross Sales])
Exper2:- Sum([Sales Return])
Exper3:- Sum([Off Invoice Discounts])
Exper4:- Sum([Sales Promotions])
Exper5:- Column(1)+Column(2)+Column(3)+Column(4)
And you get this type of the chart
- Mark as New
- Bookmark
- Subscribe
- Mute
- Subscribe to RSS Feed
- Permalink
- Report Inappropriate Content
Anand i can achieve as your example
please see the qvw whit a little example , sure i am doing something wrong
thank you a lot
Fernando
- Mark as New
- Bookmark
- Subscribe
- Mute
- Subscribe to RSS Feed
- Permalink
- Report Inappropriate Content
Here is a sample using Nivel as dimension and sum(Total) as expression, then just use the relabeled total line.
- Mark as New
- Bookmark
- Subscribe
- Mute
- Subscribe to RSS Feed
- Permalink
- Report Inappropriate Content
You can take straight table and
Dimension:- Nivel1
Expression:- Sum(Total)
- Mark as New
- Bookmark
- Subscribe
- Mute
- Subscribe to RSS Feed
- Permalink
- Report Inappropriate Content
In this you can use the pivot table also but you have to write 6 expressions
LOAD Nivel1,
//Total,
Total as TotalValue
FROM
[Book1.xlsx]
(ooxml, embedded labels, table is Sheet1);
=Sum( {<Nivel1 = {'Administrativo'}> } TotalValue)
=Sum( {<Nivel1 = {'Comercial'}> } TotalValue)
=Sum( {<Nivel1 = {'Finanzas'}> } TotalValue)
=Sum( {<Nivel1 = {'Sueldos'}> } TotalValue)
=Sum( {<Nivel1 = {'Licencias'}> } TotalValue)
=Column(1)+Column(2)+Column(3)+Column(4)+Column(5) //NET SALES
- Mark as New
- Bookmark
- Subscribe
- Mute
- Subscribe to RSS Feed
- Permalink
- Report Inappropriate Content
Thank you a lot!
I find other solution that works OK too
http://www.visvero.com/uncategorized/qlikview-subtotaling-customization-part-2/
Thank you anand,swuelh