Unlock a world of possibilities! Login now and discover the exclusive benefits awaiting you.
- Qlik Community
- :
- All Forums
- :
- QlikView App Dev
- :
- Re: Dimension as legend for multi expression
- Subscribe to RSS Feed
- Mark Topic as New
- Mark Topic as Read
- Float this Topic for Current User
- Bookmark
- Subscribe
- Mute
- Printer Friendly Page
- Mark as New
- Bookmark
- Subscribe
- Mute
- Subscribe to RSS Feed
- Permalink
- Report Inappropriate Content
Dimension as legend for multi expression
I need to show the dimensions as my legend values. It is working when i am having only one expression but with more than one, the expression value is coming as legend rather than dimension values.
Sample is attached. Any help would be appreciated.
Thanks.
- Mark as New
- Bookmark
- Subscribe
- Mute
- Subscribe to RSS Feed
- Permalink
- Report Inappropriate Content
Hello,
Try this.
- Mark as New
- Bookmark
- Subscribe
- Mute
- Subscribe to RSS Feed
- Permalink
- Report Inappropriate Content
Thanks Vamsee, but the given idea is not working. It is still showing the expression value in the legends.
- Mark as New
- Bookmark
- Subscribe
- Mute
- Subscribe to RSS Feed
- Permalink
- Report Inappropriate Content
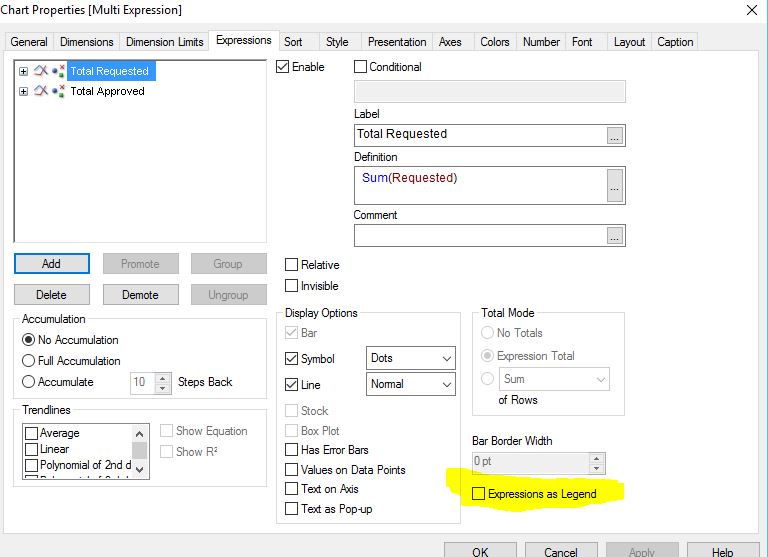
Hi Suresh,
u can click on chartproperties---> Expressions ---> click on Expression as Legend
- Mark as New
- Bookmark
- Subscribe
- Mute
- Subscribe to RSS Feed
- Permalink
- Report Inappropriate Content
Hi,
- Mark as New
- Bookmark
- Subscribe
- Mute
- Subscribe to RSS Feed
- Permalink
- Report Inappropriate Content
I need to show dimension as my legend. I am not understanding what you are saying.
- Mark as New
- Bookmark
- Subscribe
- Mute
- Subscribe to RSS Feed
- Permalink
- Report Inappropriate Content
I need to show dimension as my legend and not expression.
- Mark as New
- Bookmark
- Subscribe
- Mute
- Subscribe to RSS Feed
- Permalink
- Report Inappropriate Content
Hi Suresh,
One solution for your requirement is to create cyclic expression group.
Expression tab-> Select both expression -> click on group.
In the chart: Use the expression cycle in the bottom left to change between both expression.
I have attached the sample file.Hope this will help you.
Regards,
Binu
- Mark as New
- Bookmark
- Subscribe
- Mute
- Subscribe to RSS Feed
- Permalink
- Report Inappropriate Content
I think your scenario it won't work.
1. If you have one expression, second dimension shows as legend.
2. One dimension, you have to take 2 expressions with different attributes, if you have different measures it won't work.
One dimension as Date and 2 expressions
Sum({<Name={'Name1'}>}Requested) label as Name1
Sum({<Name={'Name2'}>}Requested) label as Name2. these shows as legend (Name1 and Name2)
OR
otherwise create Cyclic Group, based on Date and Name dimensions.
OR
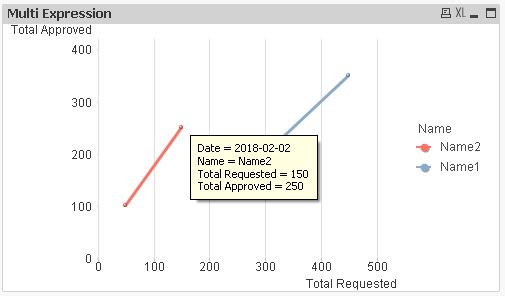
This can be possible in Scatter Chart.
Have added one more date.
LegendTest:
Load * Inline [
Date, Name, Requested, Approved
2018-01-01, Name1, 250, 150
2018-02-02, Name1, 450, 350
2018-02-02, Name2, 150, 250
2018-01-01, Name2, 50, 100 // New added
];
But this works Total based. (X and Y axis)