Unlock a world of possibilities! Login now and discover the exclusive benefits awaiting you.
- Qlik Community
- :
- All Forums
- :
- QlikView App Dev
- :
- Re: Display All months Trend Graph
- Subscribe to RSS Feed
- Mark Topic as New
- Mark Topic as Read
- Float this Topic for Current User
- Bookmark
- Subscribe
- Mute
- Printer Friendly Page
- Mark as New
- Bookmark
- Subscribe
- Mute
- Subscribe to RSS Feed
- Permalink
- Report Inappropriate Content
Display All months Trend Graph
Hi All,
I have a user requirement. He wants to see 12 months trends of particular KPI's in line graph. I have months from Jan to Dec as filter selections. His requirement is when November 2018 is selected, Graph should be plotted from November 2017 to November 2018 i.e trend should be seen from Nov to Nov. When Dec 2018 is selected, line graph should show trend from Dec 2017 to Dec 2018. Likewise when July 2017 is selected, July 2016 to July 2017 to be shown.
Problem is : i do not have data for all the months in the year, but the years must show up. For example: if i do not have data in March 2017, i still want my chart x axis to read from: Dec2016, Jan2017, Feb2017, March2017 ,Apr2017, May2017 ,June2017 ,July2017 ,Aug2017, Sept2017, Oct2017, Nov2017 ,Dec2017
All the Months must always be present on the axis for 12months back
How can I achieve this dynamic behavior?
Accepted Solutions
- Mark as New
- Bookmark
- Subscribe
- Mute
- Subscribe to RSS Feed
- Permalink
- Report Inappropriate Content
thanks for your help Sunny! your solution looks good.
However i am not able to see all the months on my trend chart (for example March 2018 data). only difference between your script and mine is in the [Sale Date] format.
what is the purpose of the Date,MonthStart and Date# functions you used?
Thanks!
Mine:
TABLE:
LOAD DryFruits,
Sales,
Flowers,
Date([SaleDate], 'M/DD/YYYY') as [Sale Date]
FROM [Fruits and Flowers.xlsx] (ooxml, embedded labels, table is Sheet1);
QuartersMap:
Mapping
LOAD RowNo() as Month,
'Q' & Ceil (RowNo()/3) as Quarter
AutoGenerate (12);
Temp:
LOAD Min([Sale Date]) as minDate,
Max([Sale Date]) as maxDate
Resident TABLE;
LET varMinDate = Num(Peek('minDate', 0, 'Temp'));
LET varMaxDate = Num(Peek('maxDate', 0, 'Temp'));
DROP Table Temp;
TempCalendar:
LOAD Date($(varMinDate) + IterNo() - 1) as TempDate
AutoGenerate 1
While $(varMinDate) + IterNo() -1 <= $(varMaxDate);
MasterCalendar:
LOAD TempDate as [Sale Date],
Week(TempDate) as Week,
Year(TempDate) as Year,
Month(TempDate) as Month,
Day(TempDate) as Day,
YeartoDate(TempDate)*-1 as CurYTDFlag,
YeartoDate(TempDate,-1)*-1 as LastYTDFlag,
InYear(TempDate, MonthStart($(varMaxDate)),-1) as RC12,
Date(MonthStart(TempDate), 'MMM-YYYY') as MonthYear,
ApplyMap('QuartersMap', month(TempDate), Null()) as Quarter,
Week(WeekStart(TempDate)) & '-' & WeekYear(TempDate) as WeekYear,
WeekDay(TempDate) as WeekDay
Resident TempCalendar
Order By TempDate ASC;
DROP Table TempCalendar;
Yours:
Table:
LOAD DryFruits,
Sales,
Flowers,
Date(MonthStart(Date#([Sale Date], 'MMM YYYY'))) as [Sale Date]
FROM [Fruits and Flowers.xlsx]
(ooxml, embedded labels);
QuartersMap:
Mapping
LOAD RowNo() as Month,
'Q' & Ceil (RowNo()/3) as Quarter
AutoGenerate (12);
Temp:
LOAD Min([Sale Date]) as minDate,
Max([Sale Date]) as maxDate
Resident Table;
LET varMinDate = Num(Peek('minDate', 0, 'Temp'));
LET varMaxDate = Num(Peek('maxDate', 0, 'Temp'));
DROP Table Temp;
TempCalendar:
LOAD Date($(varMinDate) + IterNo() - 1) as TempDate
AutoGenerate 1
While $(varMinDate) + IterNo() -1 <= $(varMaxDate);
MasterCalendar:
LOAD TempDate as [Sale Date],
Week(TempDate) as Week,
Year(TempDate) as Year,
Month(TempDate) as Month,
Day(TempDate) as Day,
YeartoDate(TempDate)*-1 as CurYTDFlag,
YeartoDate(TempDate,-1)*-1 as LastYTDFlag,
InYear(TempDate, MonthStart($(varMaxDate)),-1) as RC12,
Date(MonthStart(TempDate), 'MMM-YYYY') as MonthYear,
ApplyMap('QuartersMap', month(TempDate), Null()) as Quarter,
Week(WeekStart(TempDate)) & '-' & WeekYear(TempDate) as WeekYear,
WeekDay(TempDate) as WeekDay
Resident TempCalendar
Order By TempDate ASC;
DROP Table TempCalendar;
- Mark as New
- Bookmark
- Subscribe
- Mute
- Subscribe to RSS Feed
- Permalink
- Report Inappropriate Content
Create a MasterCalendar and try this expression
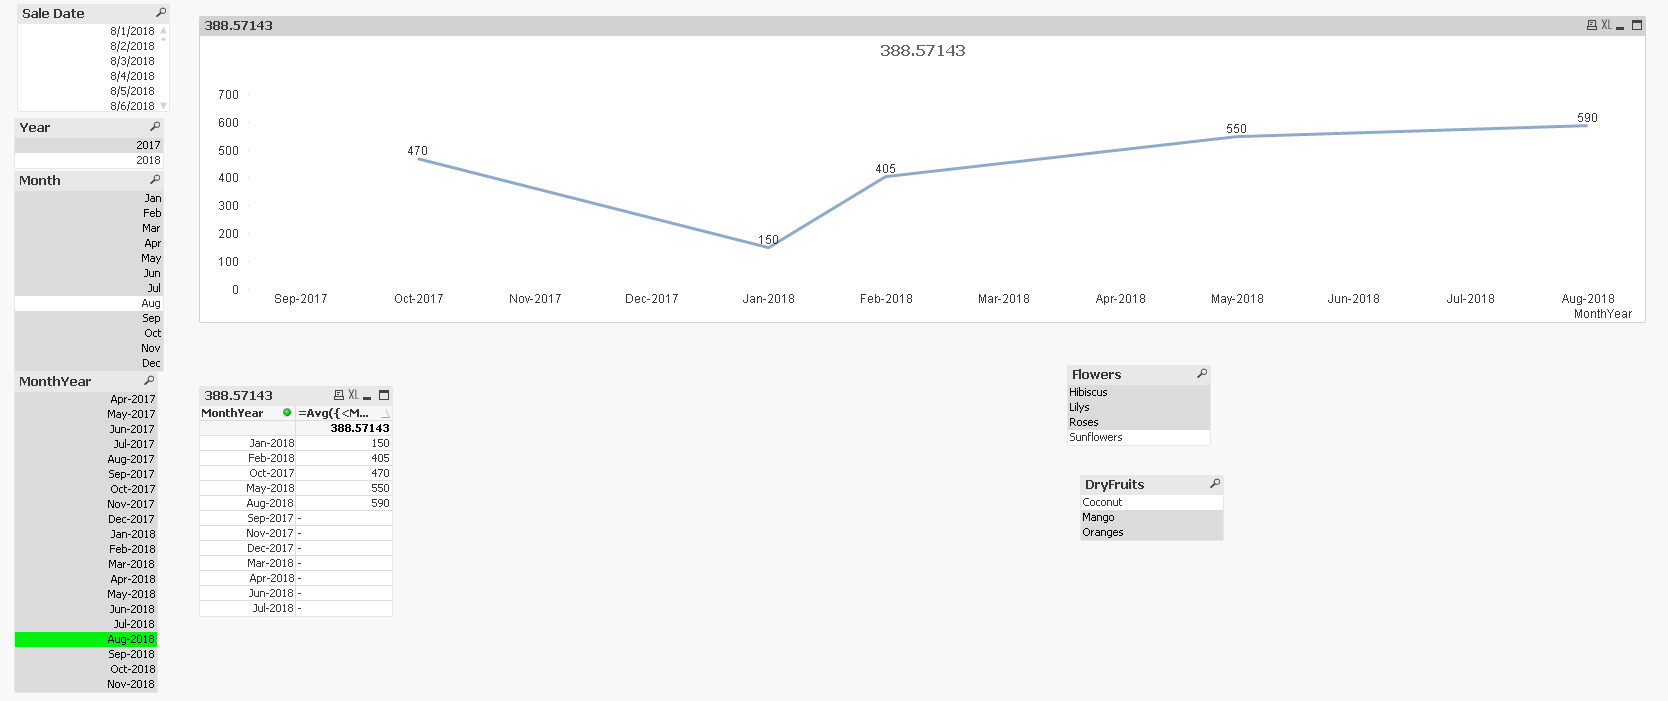
=Avg({<MonthYear = {">=$(=Date(AddMonths(Max(MonthYear), -11), 'MMM-YYYY'))<=$(=Date(Max(MonthYear), 'MMM-YYYY'))"}, Year, Month>} Sales)
- Mark as New
- Bookmark
- Subscribe
- Mute
- Subscribe to RSS Feed
- Permalink
- Report Inappropriate Content
thanks for your help Sunny! your solution looks good.
However i am not able to see all the months on my trend chart (for example March 2018 data). only difference between your script and mine is in the [Sale Date] format.
what is the purpose of the Date,MonthStart and Date# functions you used?
Thanks!
Mine:
TABLE:
LOAD DryFruits,
Sales,
Flowers,
Date([SaleDate], 'M/DD/YYYY') as [Sale Date]
FROM [Fruits and Flowers.xlsx] (ooxml, embedded labels, table is Sheet1);
QuartersMap:
Mapping
LOAD RowNo() as Month,
'Q' & Ceil (RowNo()/3) as Quarter
AutoGenerate (12);
Temp:
LOAD Min([Sale Date]) as minDate,
Max([Sale Date]) as maxDate
Resident TABLE;
LET varMinDate = Num(Peek('minDate', 0, 'Temp'));
LET varMaxDate = Num(Peek('maxDate', 0, 'Temp'));
DROP Table Temp;
TempCalendar:
LOAD Date($(varMinDate) + IterNo() - 1) as TempDate
AutoGenerate 1
While $(varMinDate) + IterNo() -1 <= $(varMaxDate);
MasterCalendar:
LOAD TempDate as [Sale Date],
Week(TempDate) as Week,
Year(TempDate) as Year,
Month(TempDate) as Month,
Day(TempDate) as Day,
YeartoDate(TempDate)*-1 as CurYTDFlag,
YeartoDate(TempDate,-1)*-1 as LastYTDFlag,
InYear(TempDate, MonthStart($(varMaxDate)),-1) as RC12,
Date(MonthStart(TempDate), 'MMM-YYYY') as MonthYear,
ApplyMap('QuartersMap', month(TempDate), Null()) as Quarter,
Week(WeekStart(TempDate)) & '-' & WeekYear(TempDate) as WeekYear,
WeekDay(TempDate) as WeekDay
Resident TempCalendar
Order By TempDate ASC;
DROP Table TempCalendar;
Yours:
Table:
LOAD DryFruits,
Sales,
Flowers,
Date(MonthStart(Date#([Sale Date], 'MMM YYYY'))) as [Sale Date]
FROM [Fruits and Flowers.xlsx]
(ooxml, embedded labels);
QuartersMap:
Mapping
LOAD RowNo() as Month,
'Q' & Ceil (RowNo()/3) as Quarter
AutoGenerate (12);
Temp:
LOAD Min([Sale Date]) as minDate,
Max([Sale Date]) as maxDate
Resident Table;
LET varMinDate = Num(Peek('minDate', 0, 'Temp'));
LET varMaxDate = Num(Peek('maxDate', 0, 'Temp'));
DROP Table Temp;
TempCalendar:
LOAD Date($(varMinDate) + IterNo() - 1) as TempDate
AutoGenerate 1
While $(varMinDate) + IterNo() -1 <= $(varMaxDate);
MasterCalendar:
LOAD TempDate as [Sale Date],
Week(TempDate) as Week,
Year(TempDate) as Year,
Month(TempDate) as Month,
Day(TempDate) as Day,
YeartoDate(TempDate)*-1 as CurYTDFlag,
YeartoDate(TempDate,-1)*-1 as LastYTDFlag,
InYear(TempDate, MonthStart($(varMaxDate)),-1) as RC12,
Date(MonthStart(TempDate), 'MMM-YYYY') as MonthYear,
ApplyMap('QuartersMap', month(TempDate), Null()) as Quarter,
Week(WeekStart(TempDate)) & '-' & WeekYear(TempDate) as WeekYear,
WeekDay(TempDate) as WeekDay
Resident TempCalendar
Order By TempDate ASC;
DROP Table TempCalendar;
- Mark as New
- Bookmark
- Subscribe
- Mute
- Subscribe to RSS Feed
- Permalink
- Report Inappropriate Content
Hi
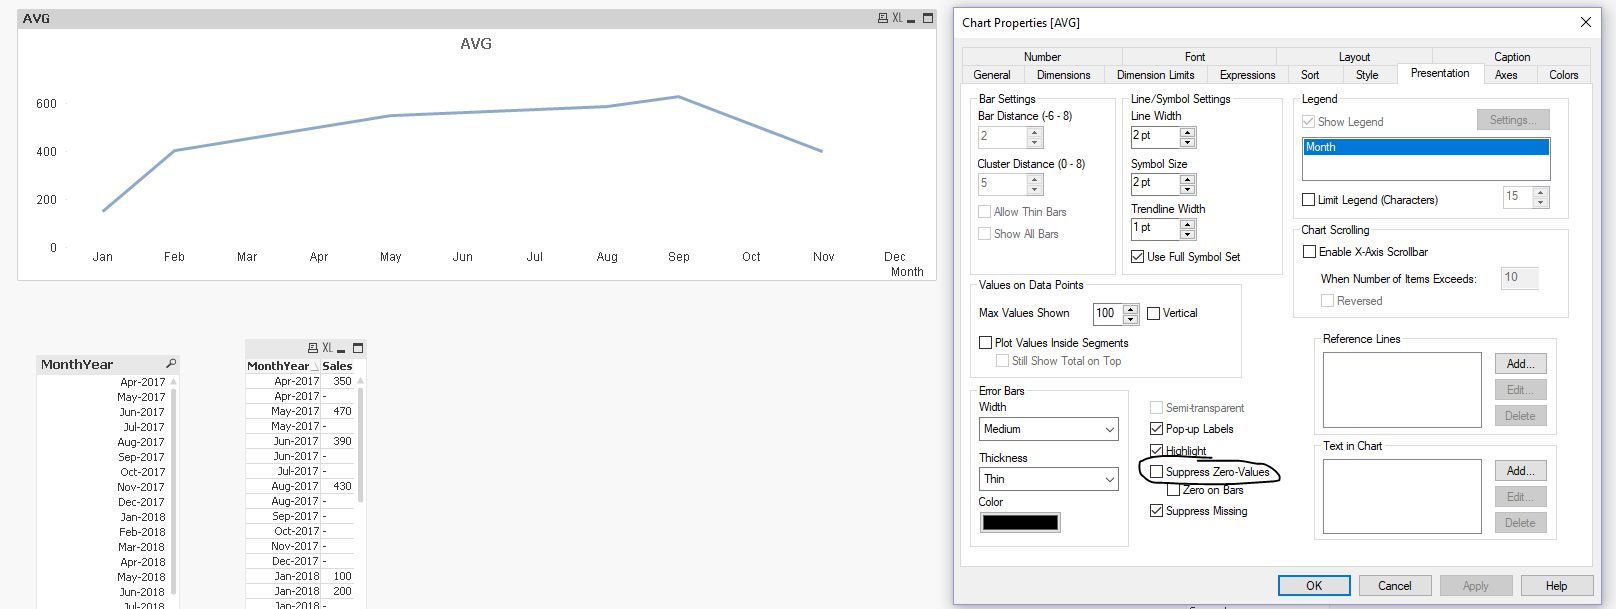
In presentation tab, uncheck suppress zero values. Then you will see all months without data as well.
- Mark as New
- Bookmark
- Subscribe
- Mute
- Subscribe to RSS Feed
- Permalink
- Report Inappropriate Content
Ankit is right... see what happens when we uncheck 'Suppress Zero-Values' on the presentation tab